Saving Custom Reports
Save custom report views with specific dimensions and metrics for reuse. Learn to create, organize, and manage saved reports with categories, timeframes, and permission settings for your team.
Permission ImplicationsAny Saved Report created is shared with all users unless the user belongs to a group that is limited to a specific set of reports. Learn more about User Groups here.
What is a Saved Report
Within the Report Builder there are stock reports. Each stock report can be saved with a unique view - saving the dimensions and metrics in the view for each time you open that report.
Allowing you to enable only the metrics that are important, coupled with applying the dimensions, eliminates the need to always spend time organizing your report, allowing you to get right into analyzing the data.
Once a report is saved, it will now live within the Saved Reports section of Analytics.
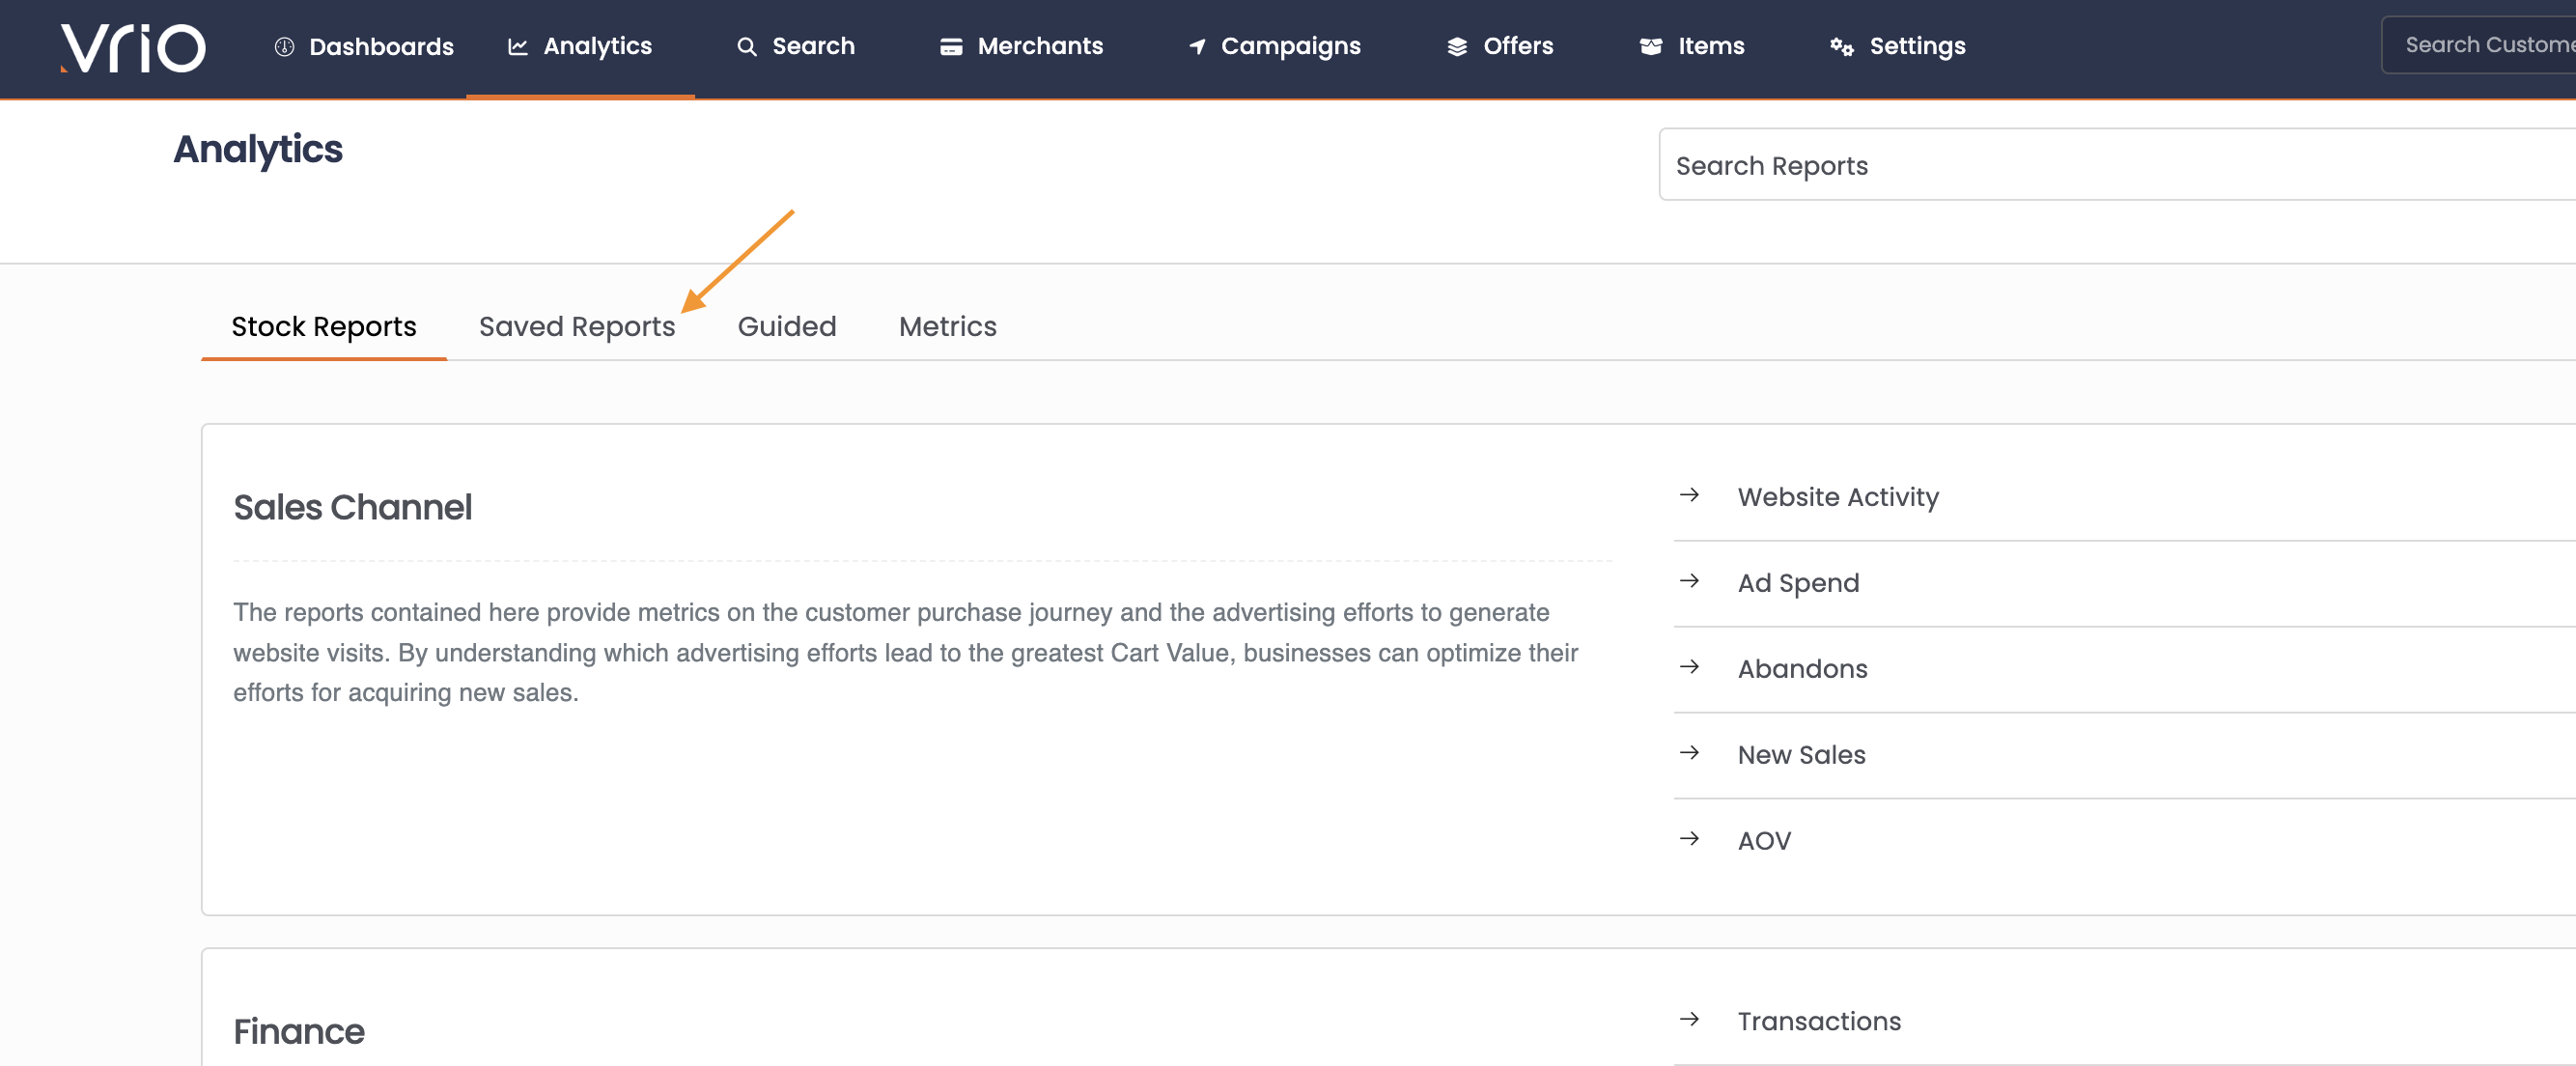
How to Save a Report
-
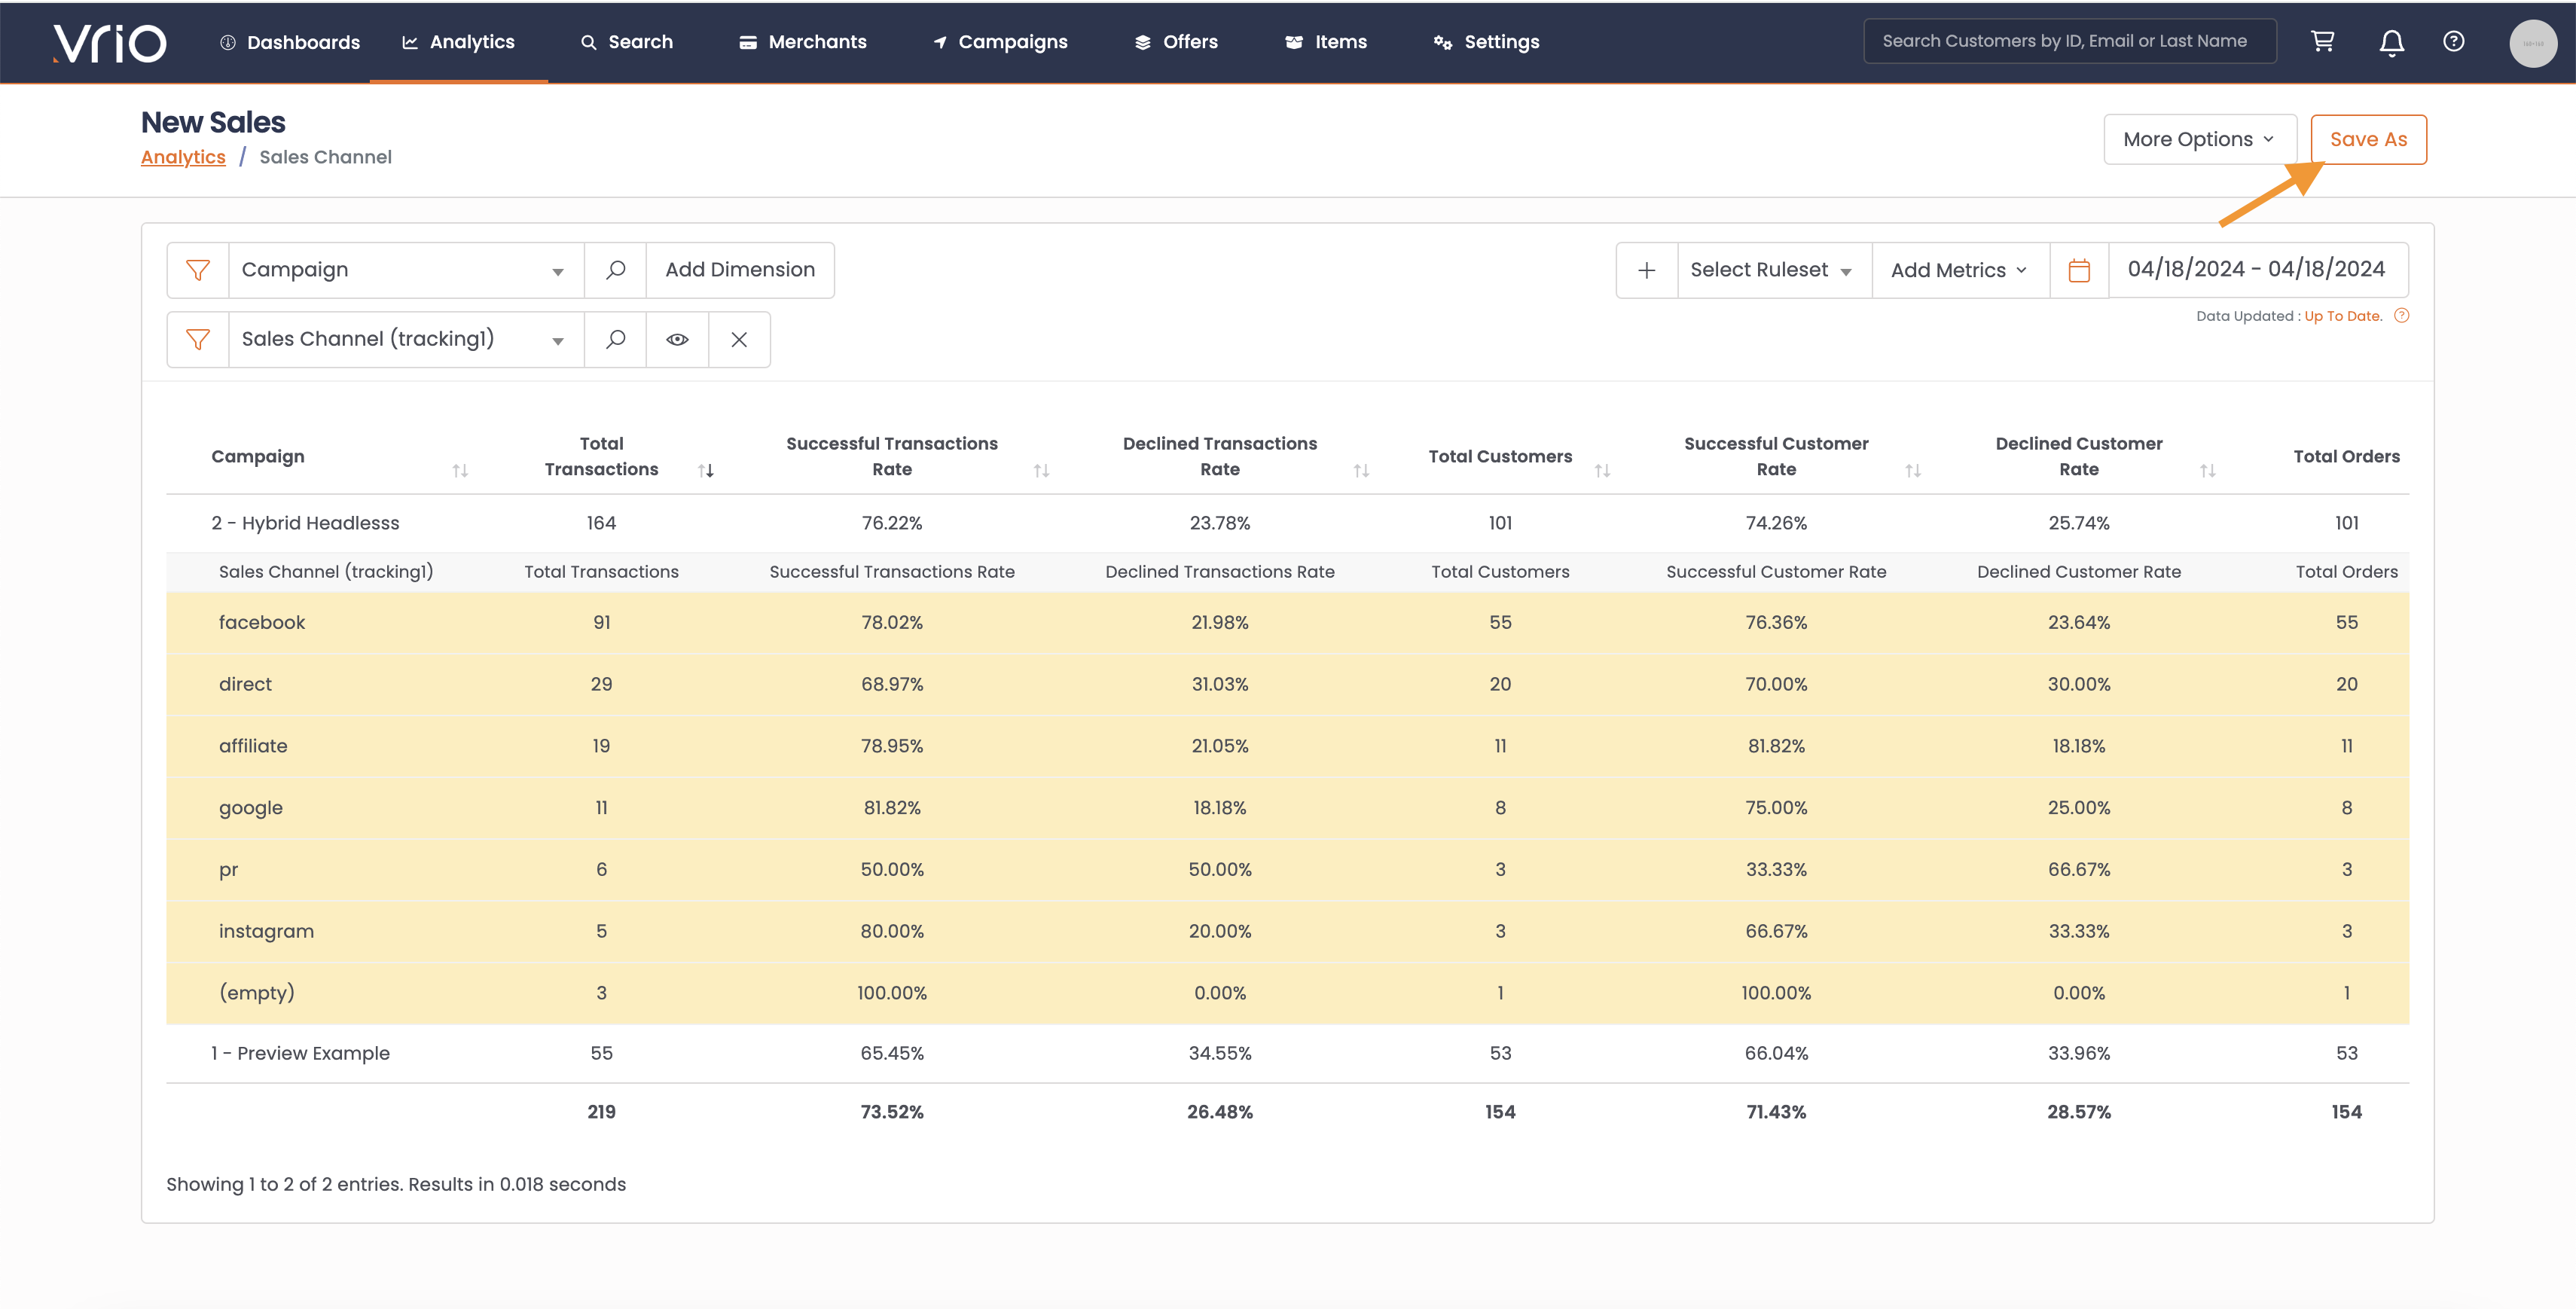
Select the Stock Report to start.
-
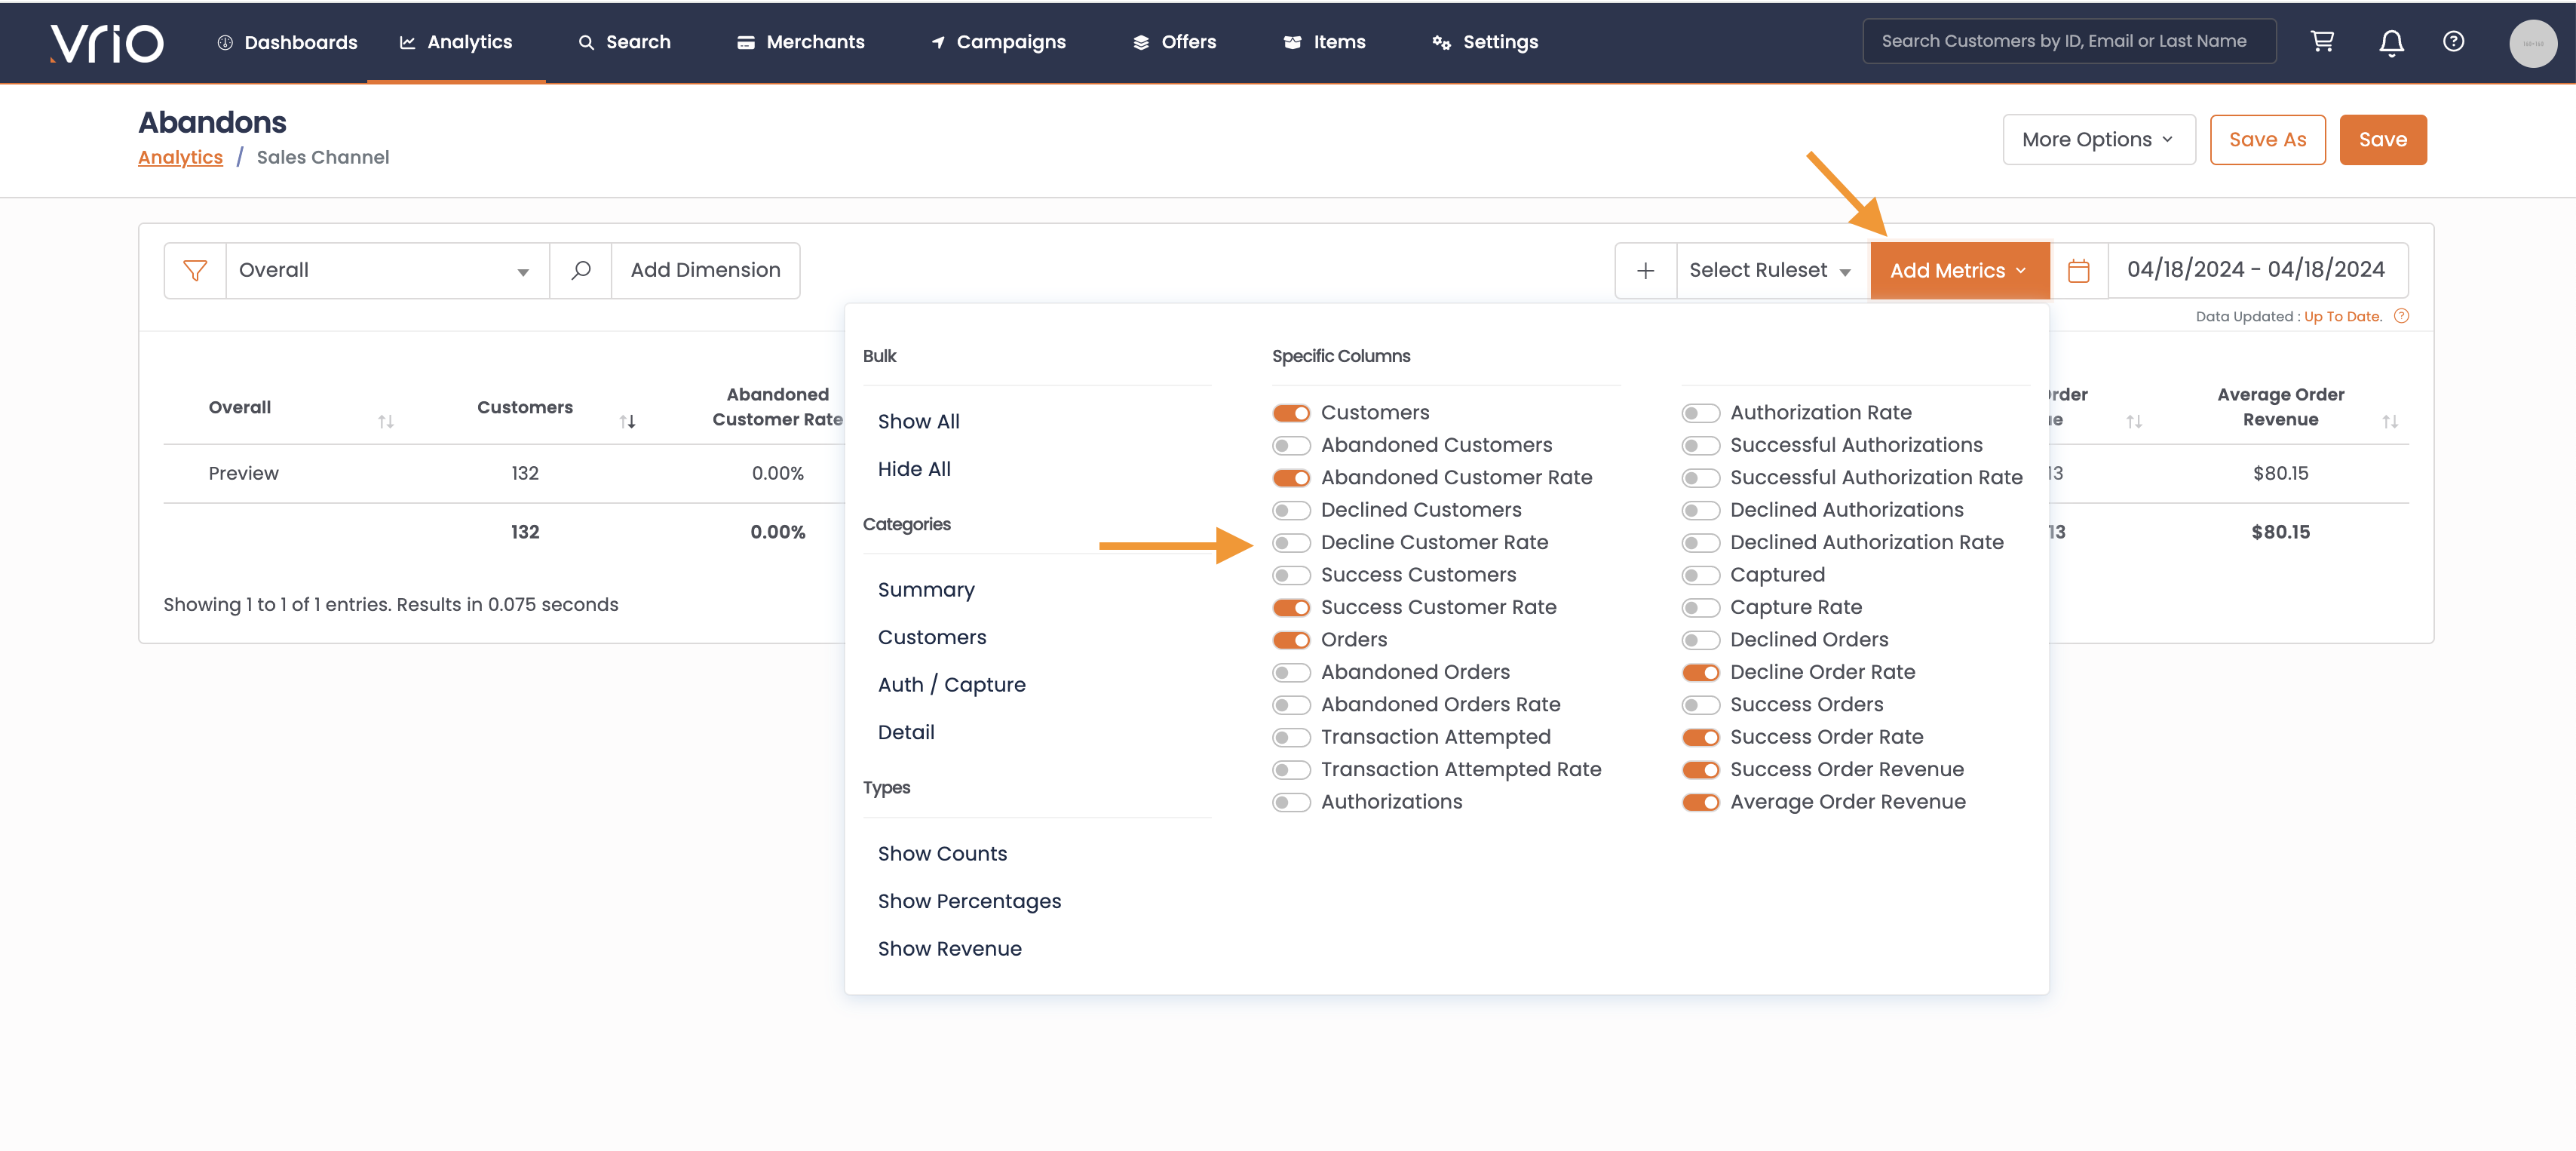
Choose the Metrics you wish to have in the default view. This will turn Metric columns on/off from view when toggled.
-
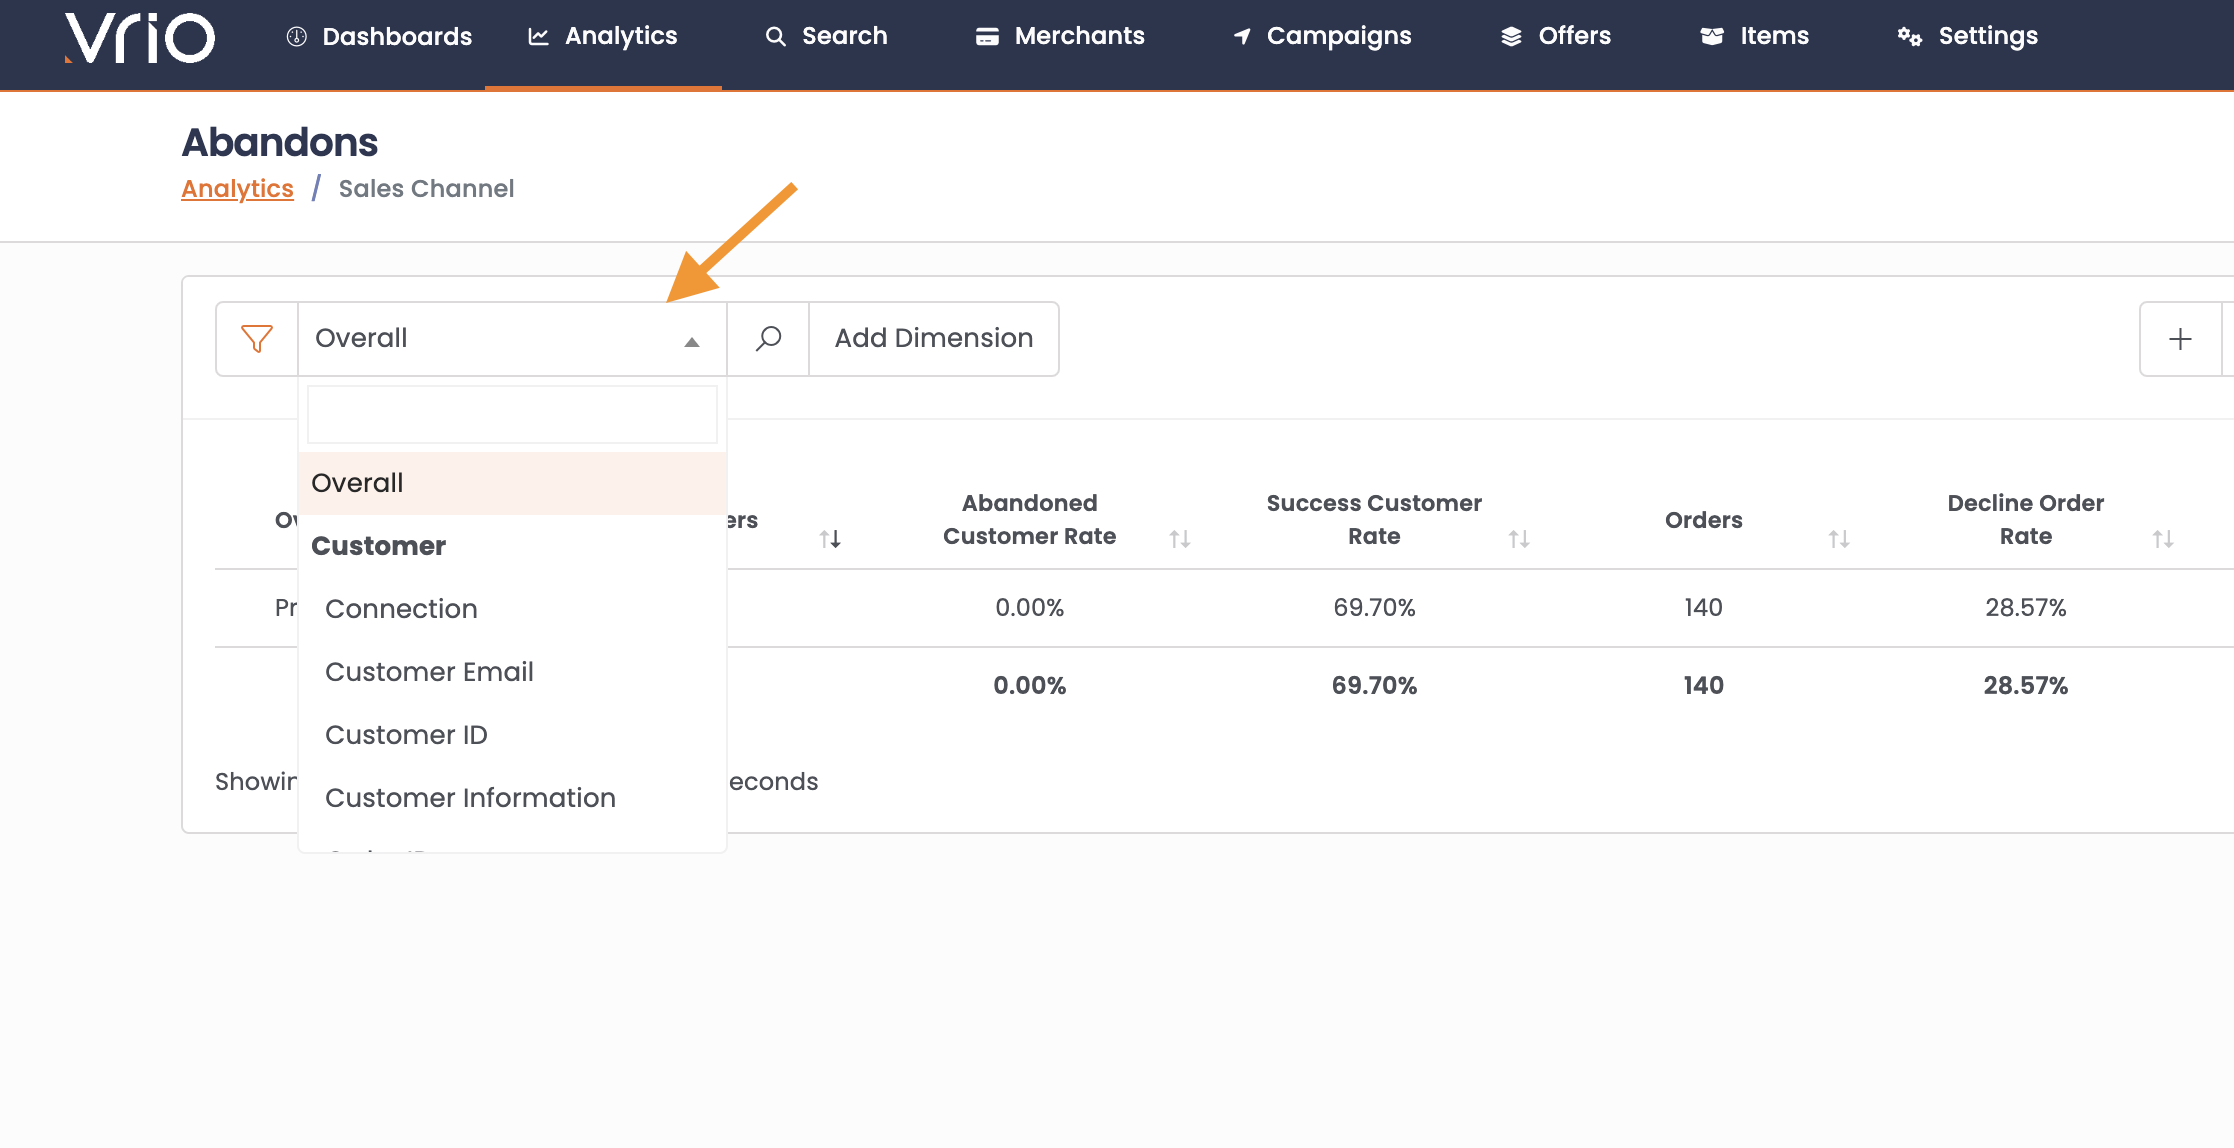
Add/edit the Dimensions for your default view. Click on the top level Dimension to adjust the starting view. Select from many Dimension options.
-
Add additional data dimensions by clicking Add Dimension.
-
Expand the view by clicking on the row within the report you wish to view.
Saved DimensionsWhen saving a report, if you click on the row(s) to expand to additional dimensions, those will always expand when returning to the saved report.
If you do not expand those at the time of saving the report, they will remain collapsed.
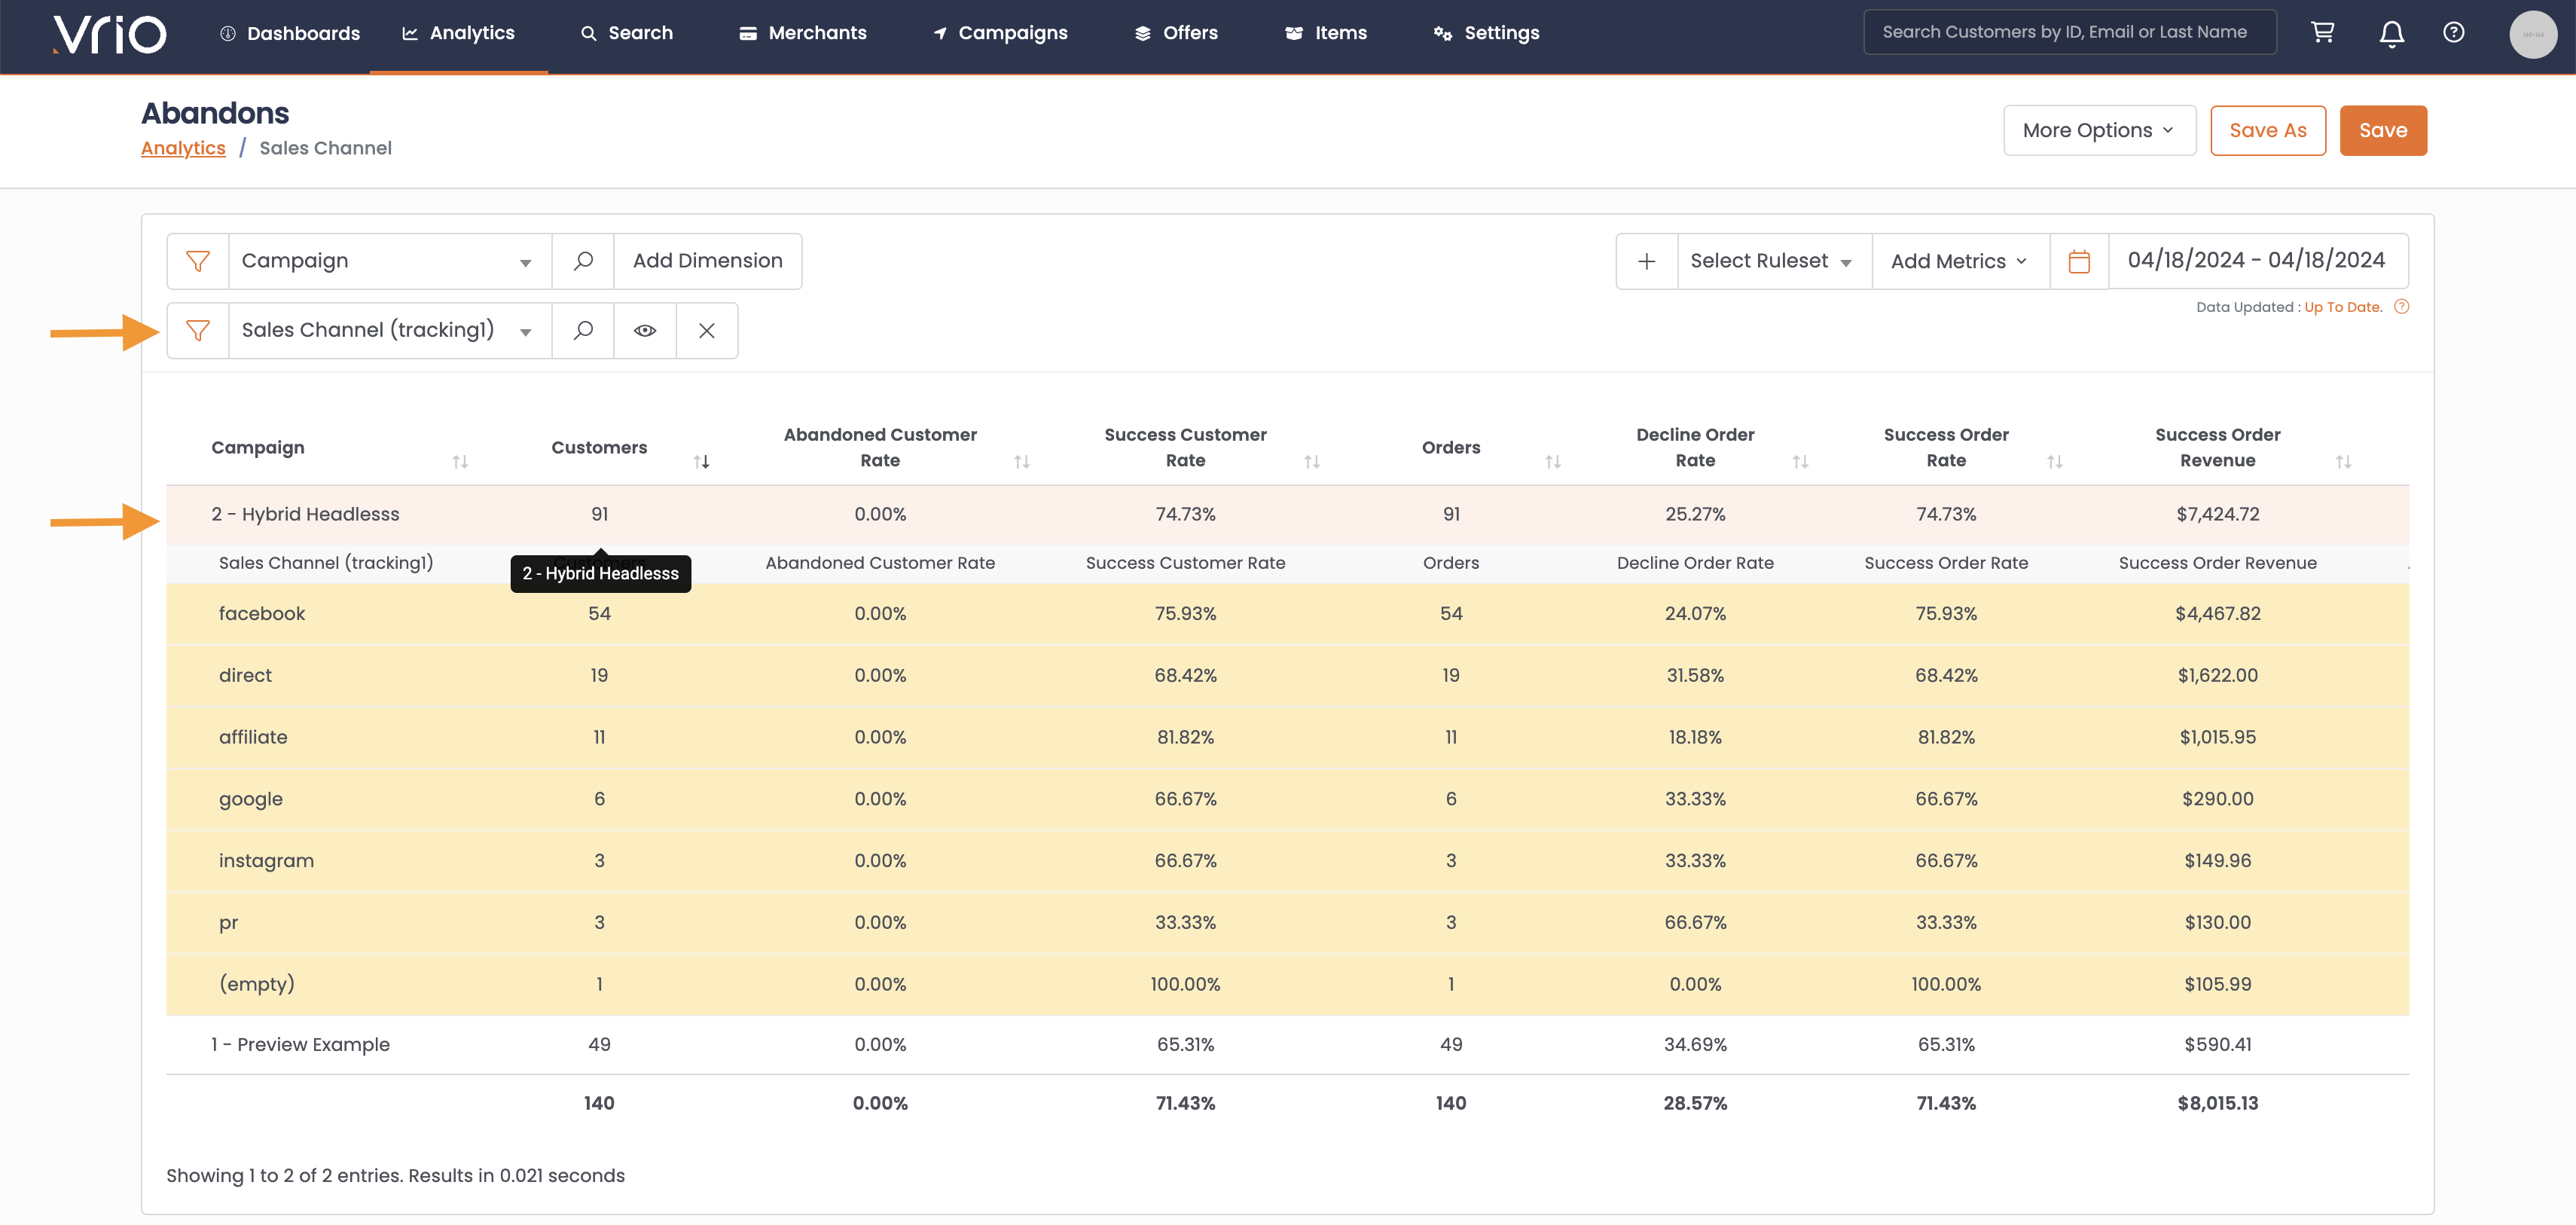
- Once the report is ready, click Save As.
-
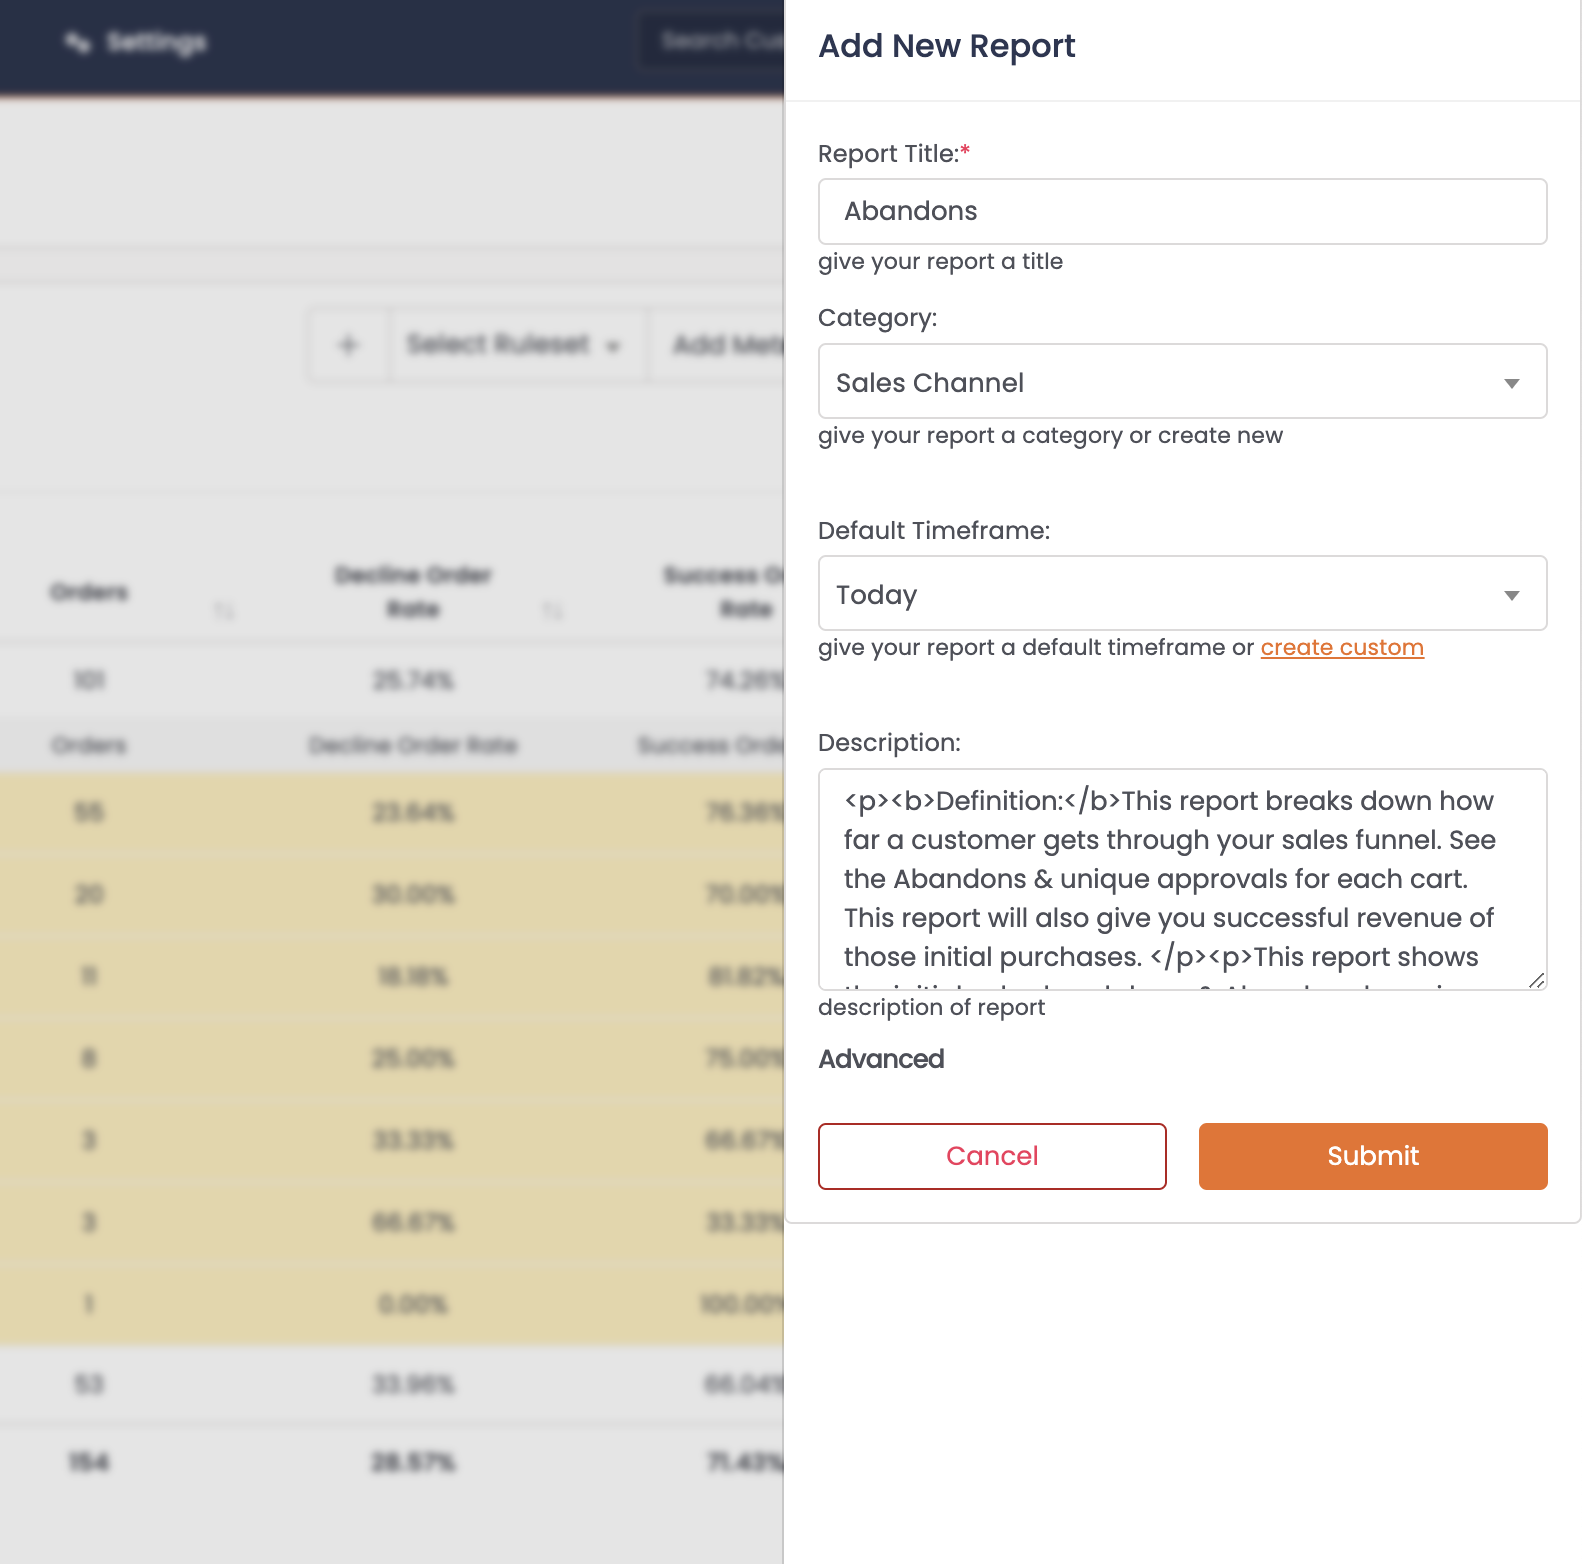
Name your Report.
-
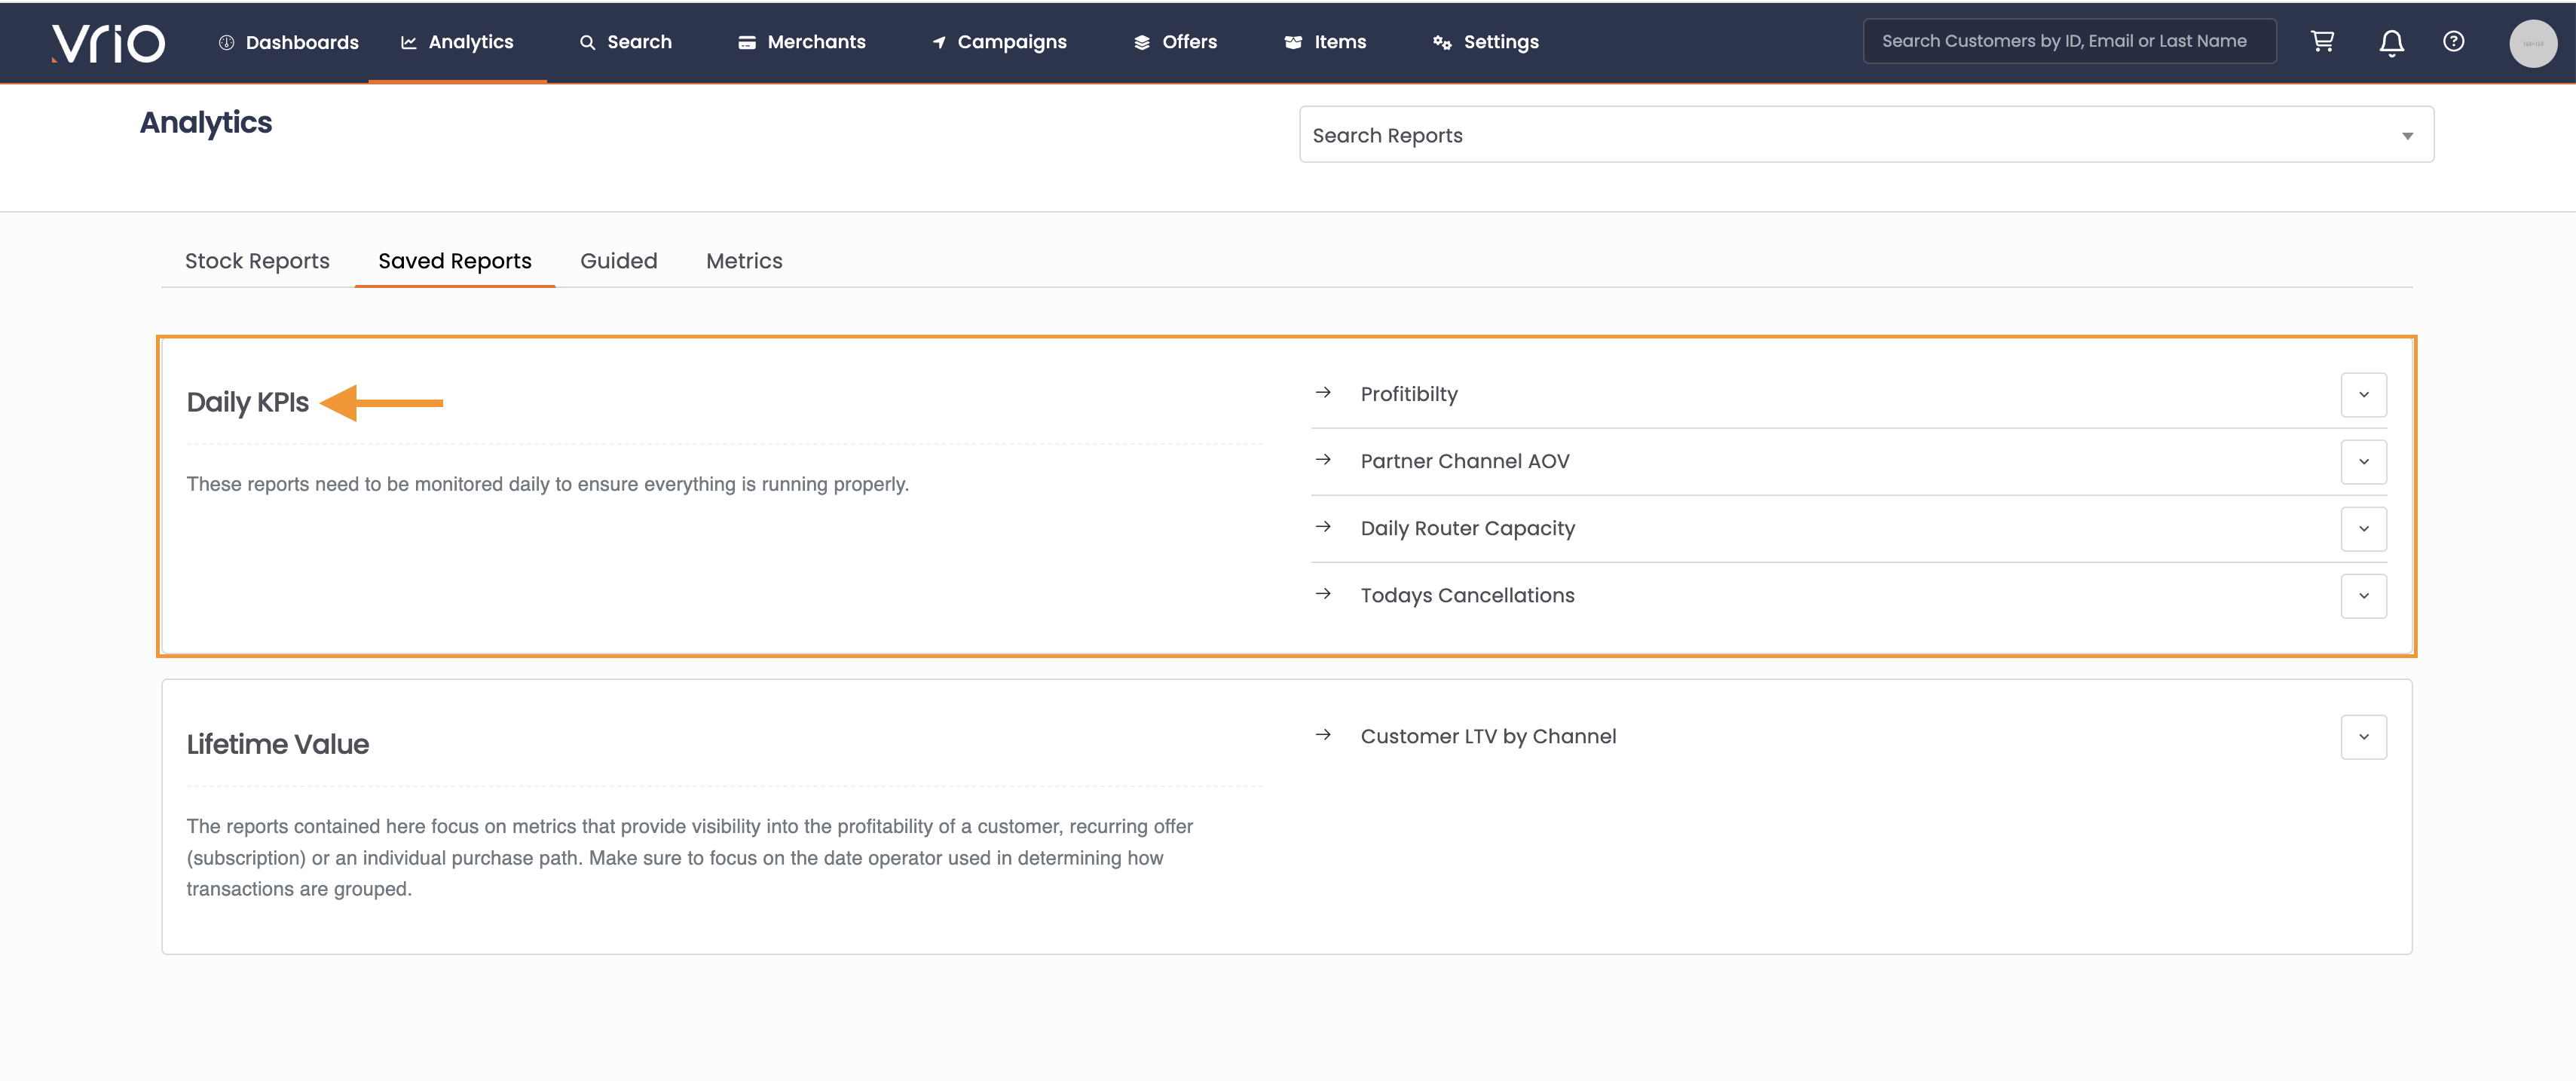
Set the Category this report should live under. Categories will allow you to group reports together on the Saved Report Tab.
Under Analytics -> Saved reports you can see the Category view here:
-
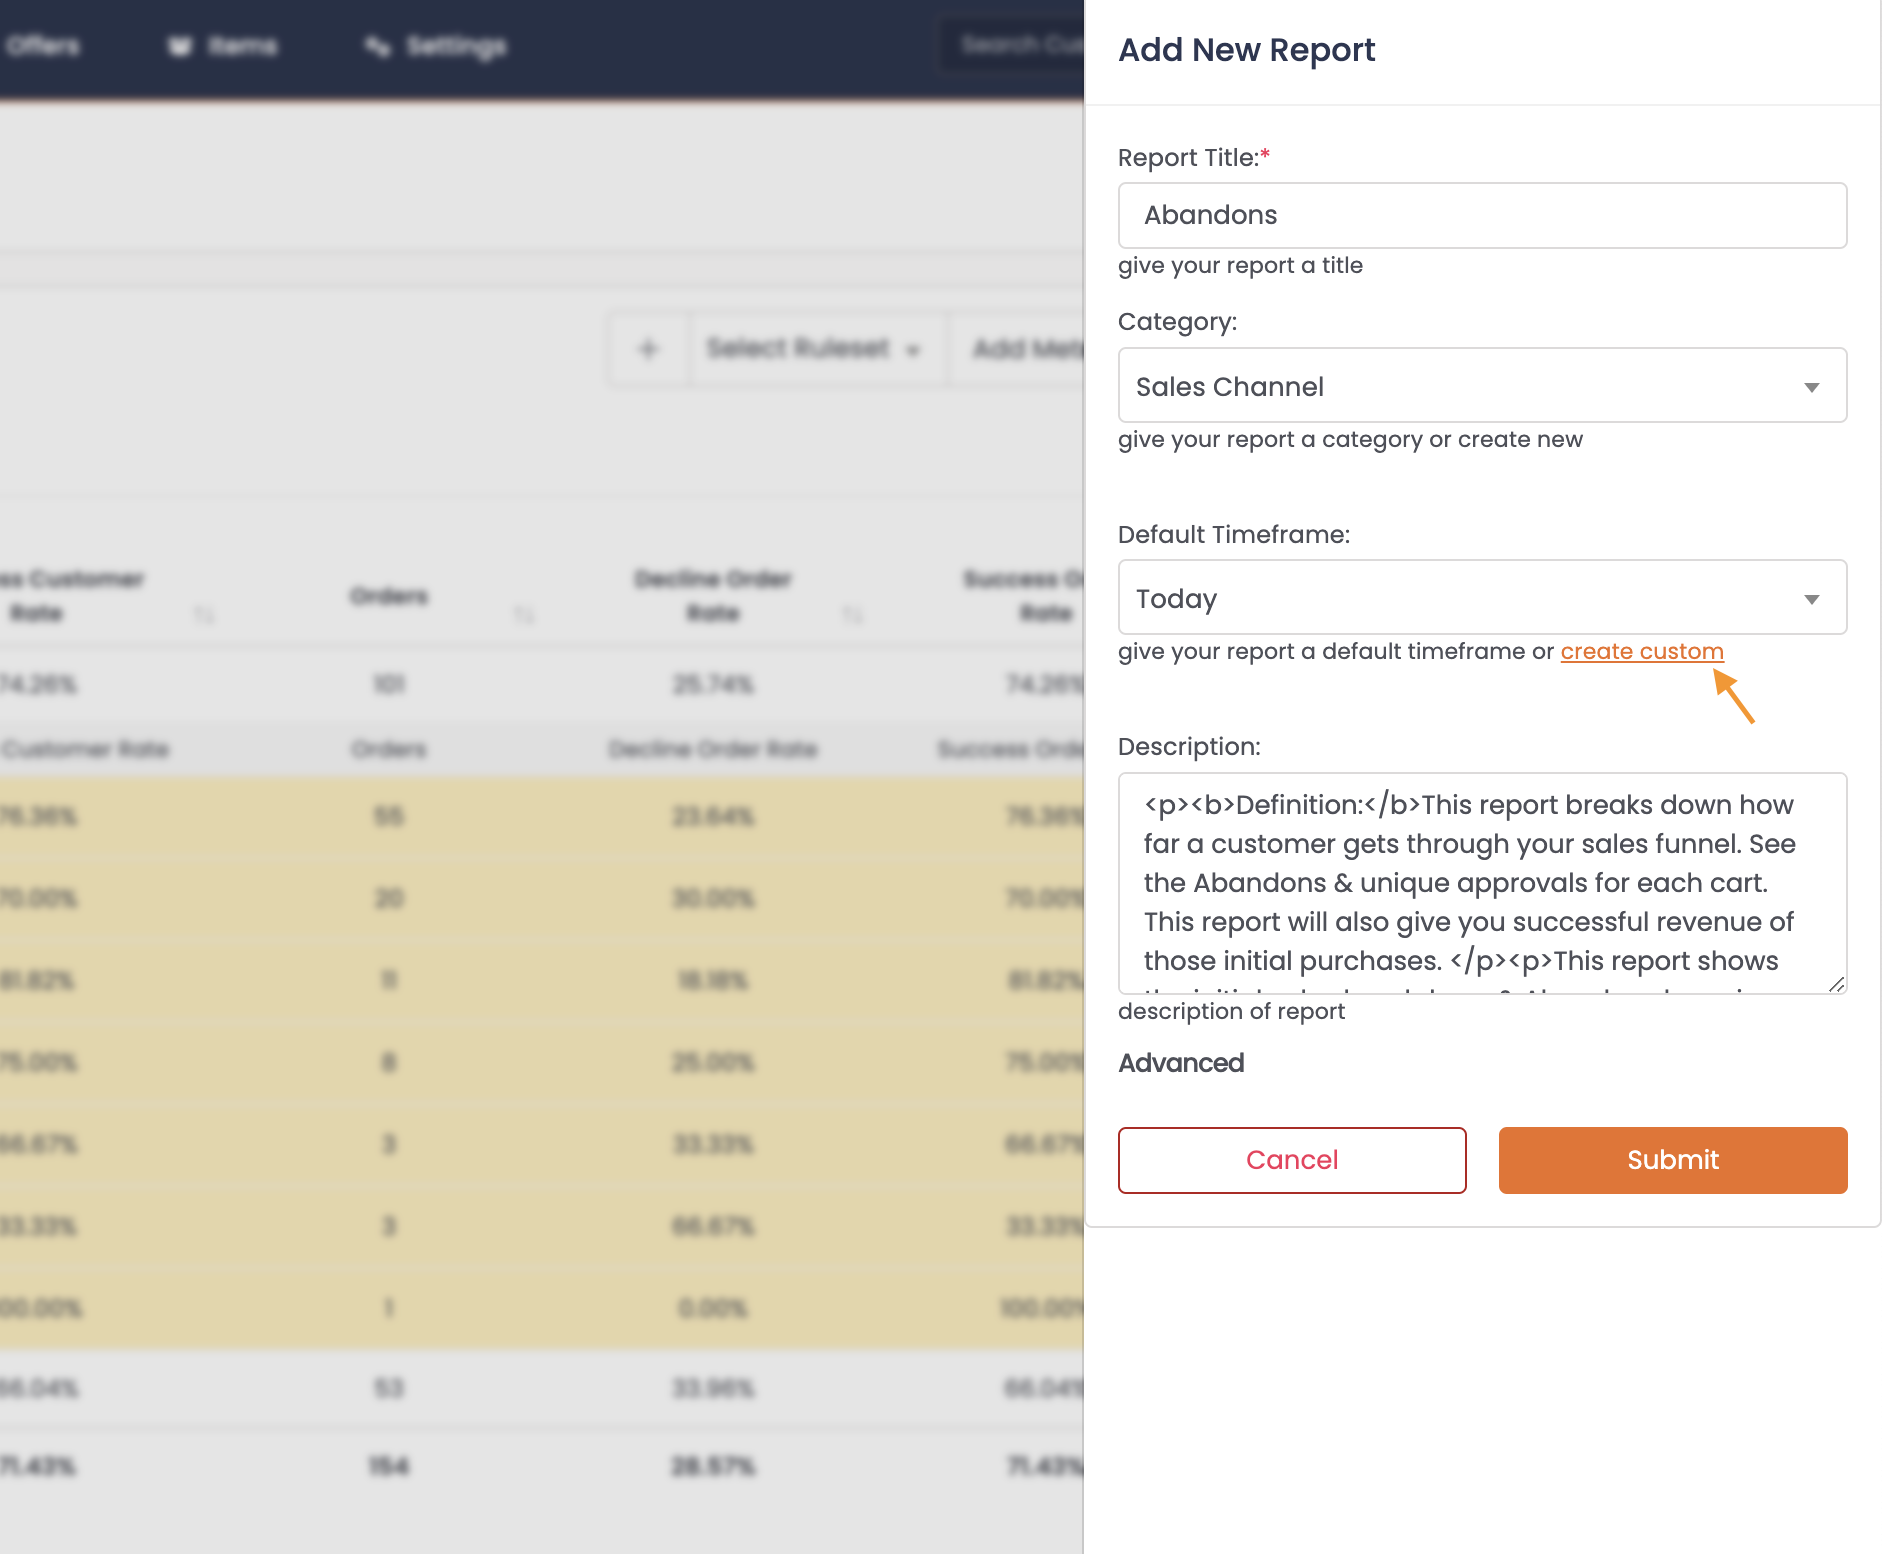
Set the Timeframe from the stock list, or create a custom timeframe.
-
Give your report a description so other users in your organization know the goal this report achieves.
-
Hit Save.
Finding a Saved Report
Once a report has been saved, it will now be available on the Saved Reports tab within the Analytics section.
Deleting a Saved Report
If you are no longer using a report and want it deleted from your view, you can set a report to Inactive.
-
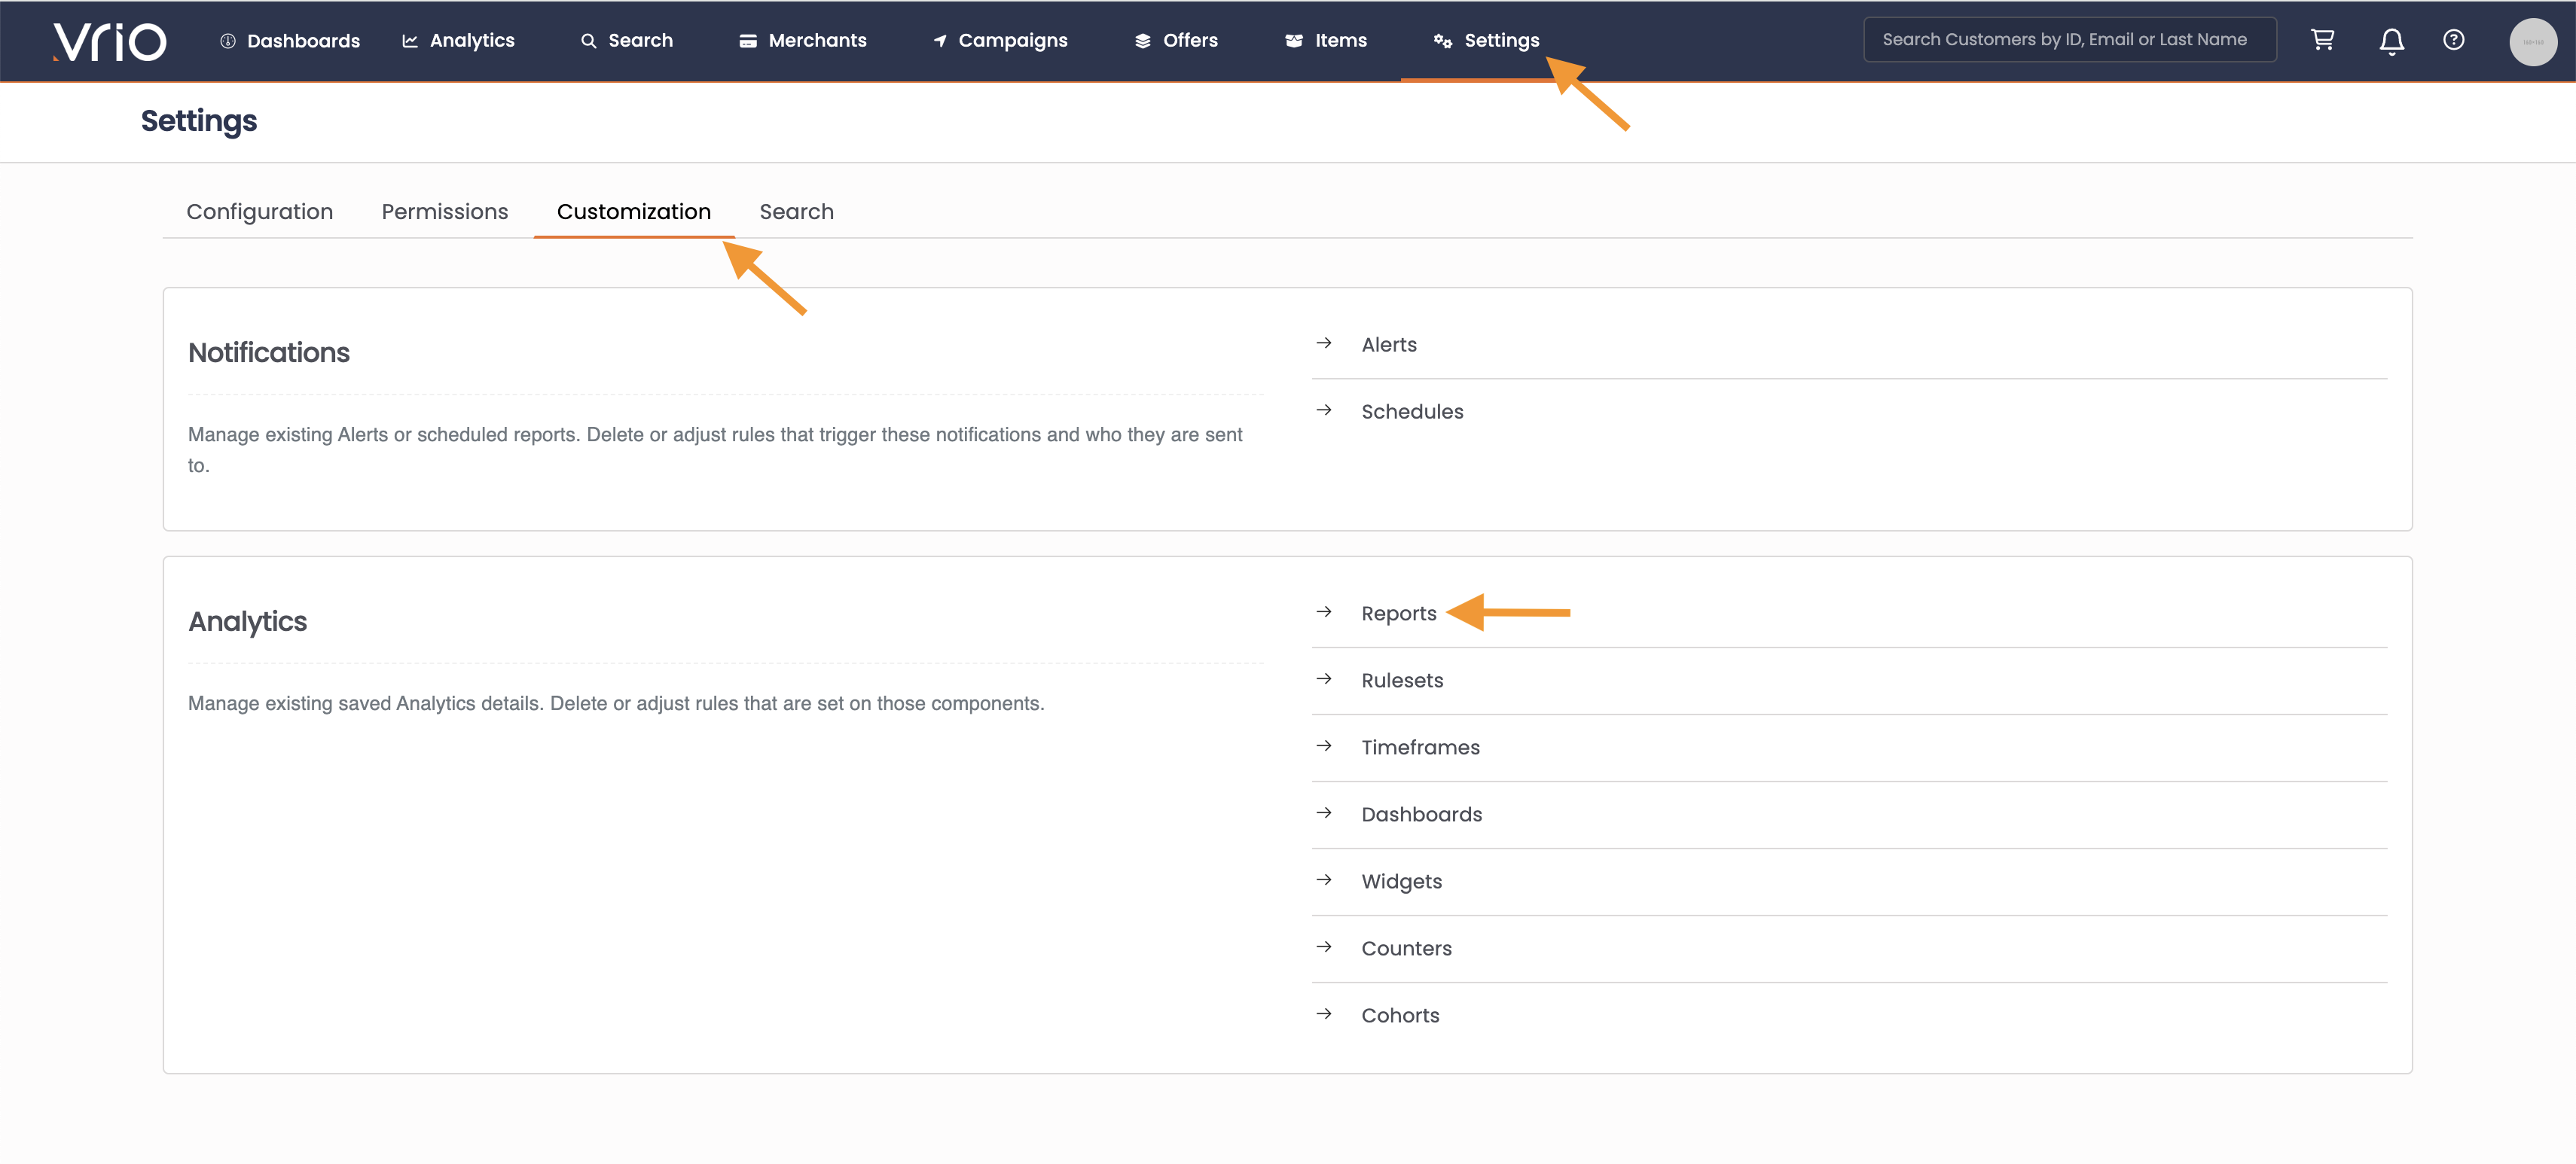
Navigate to the Settings tab.
-
Select the Customization Tab.
-
Select Reports.
-
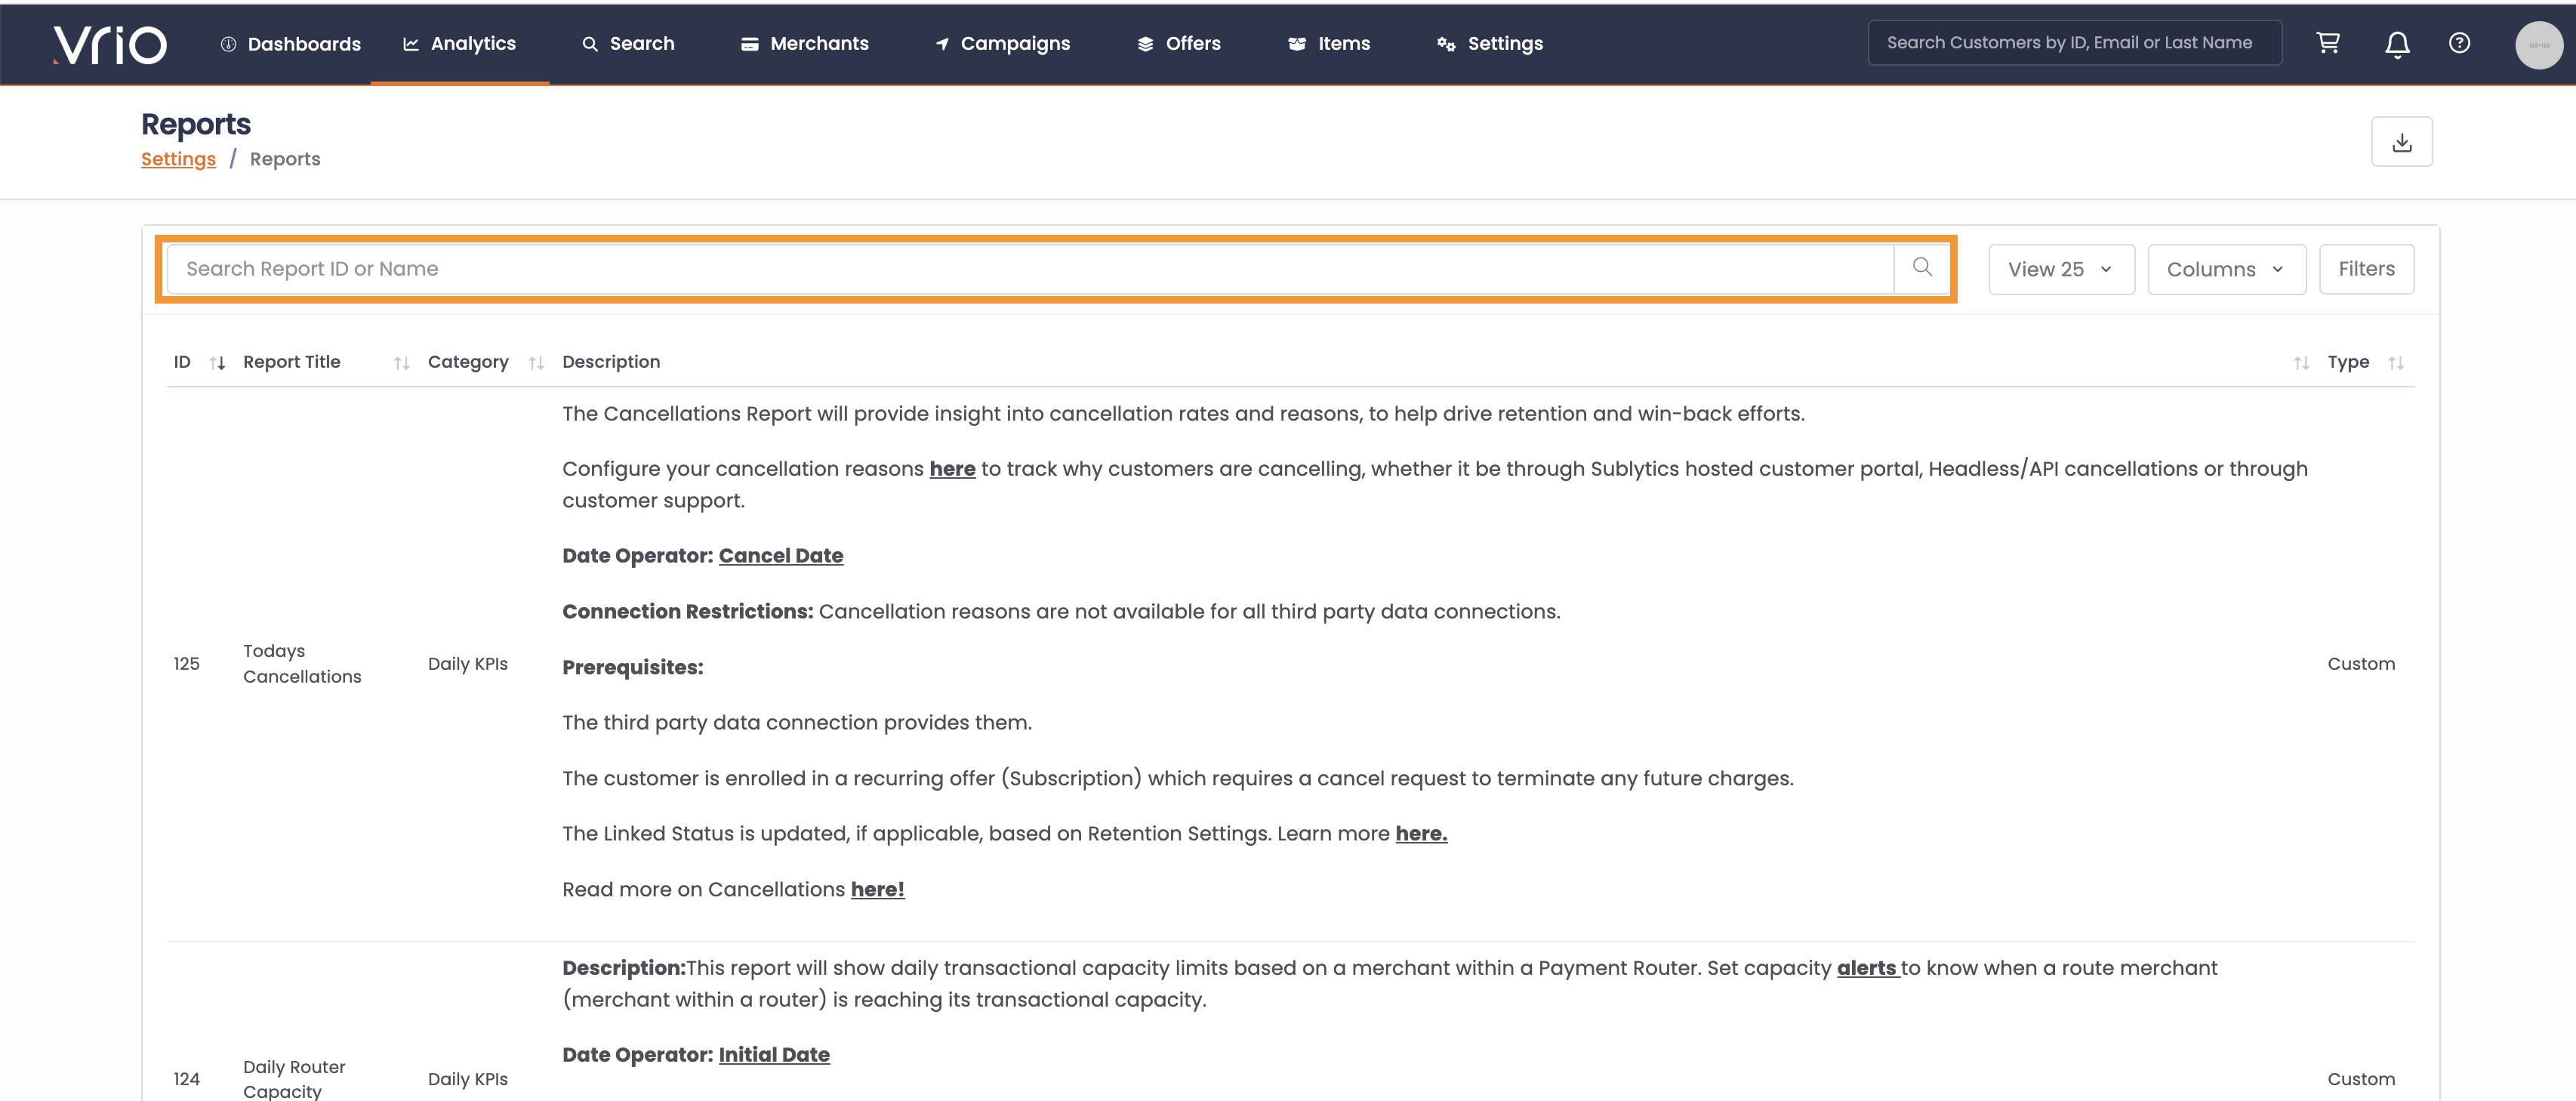
Search the report name or report ID.
-
Click on the report of choice.
-
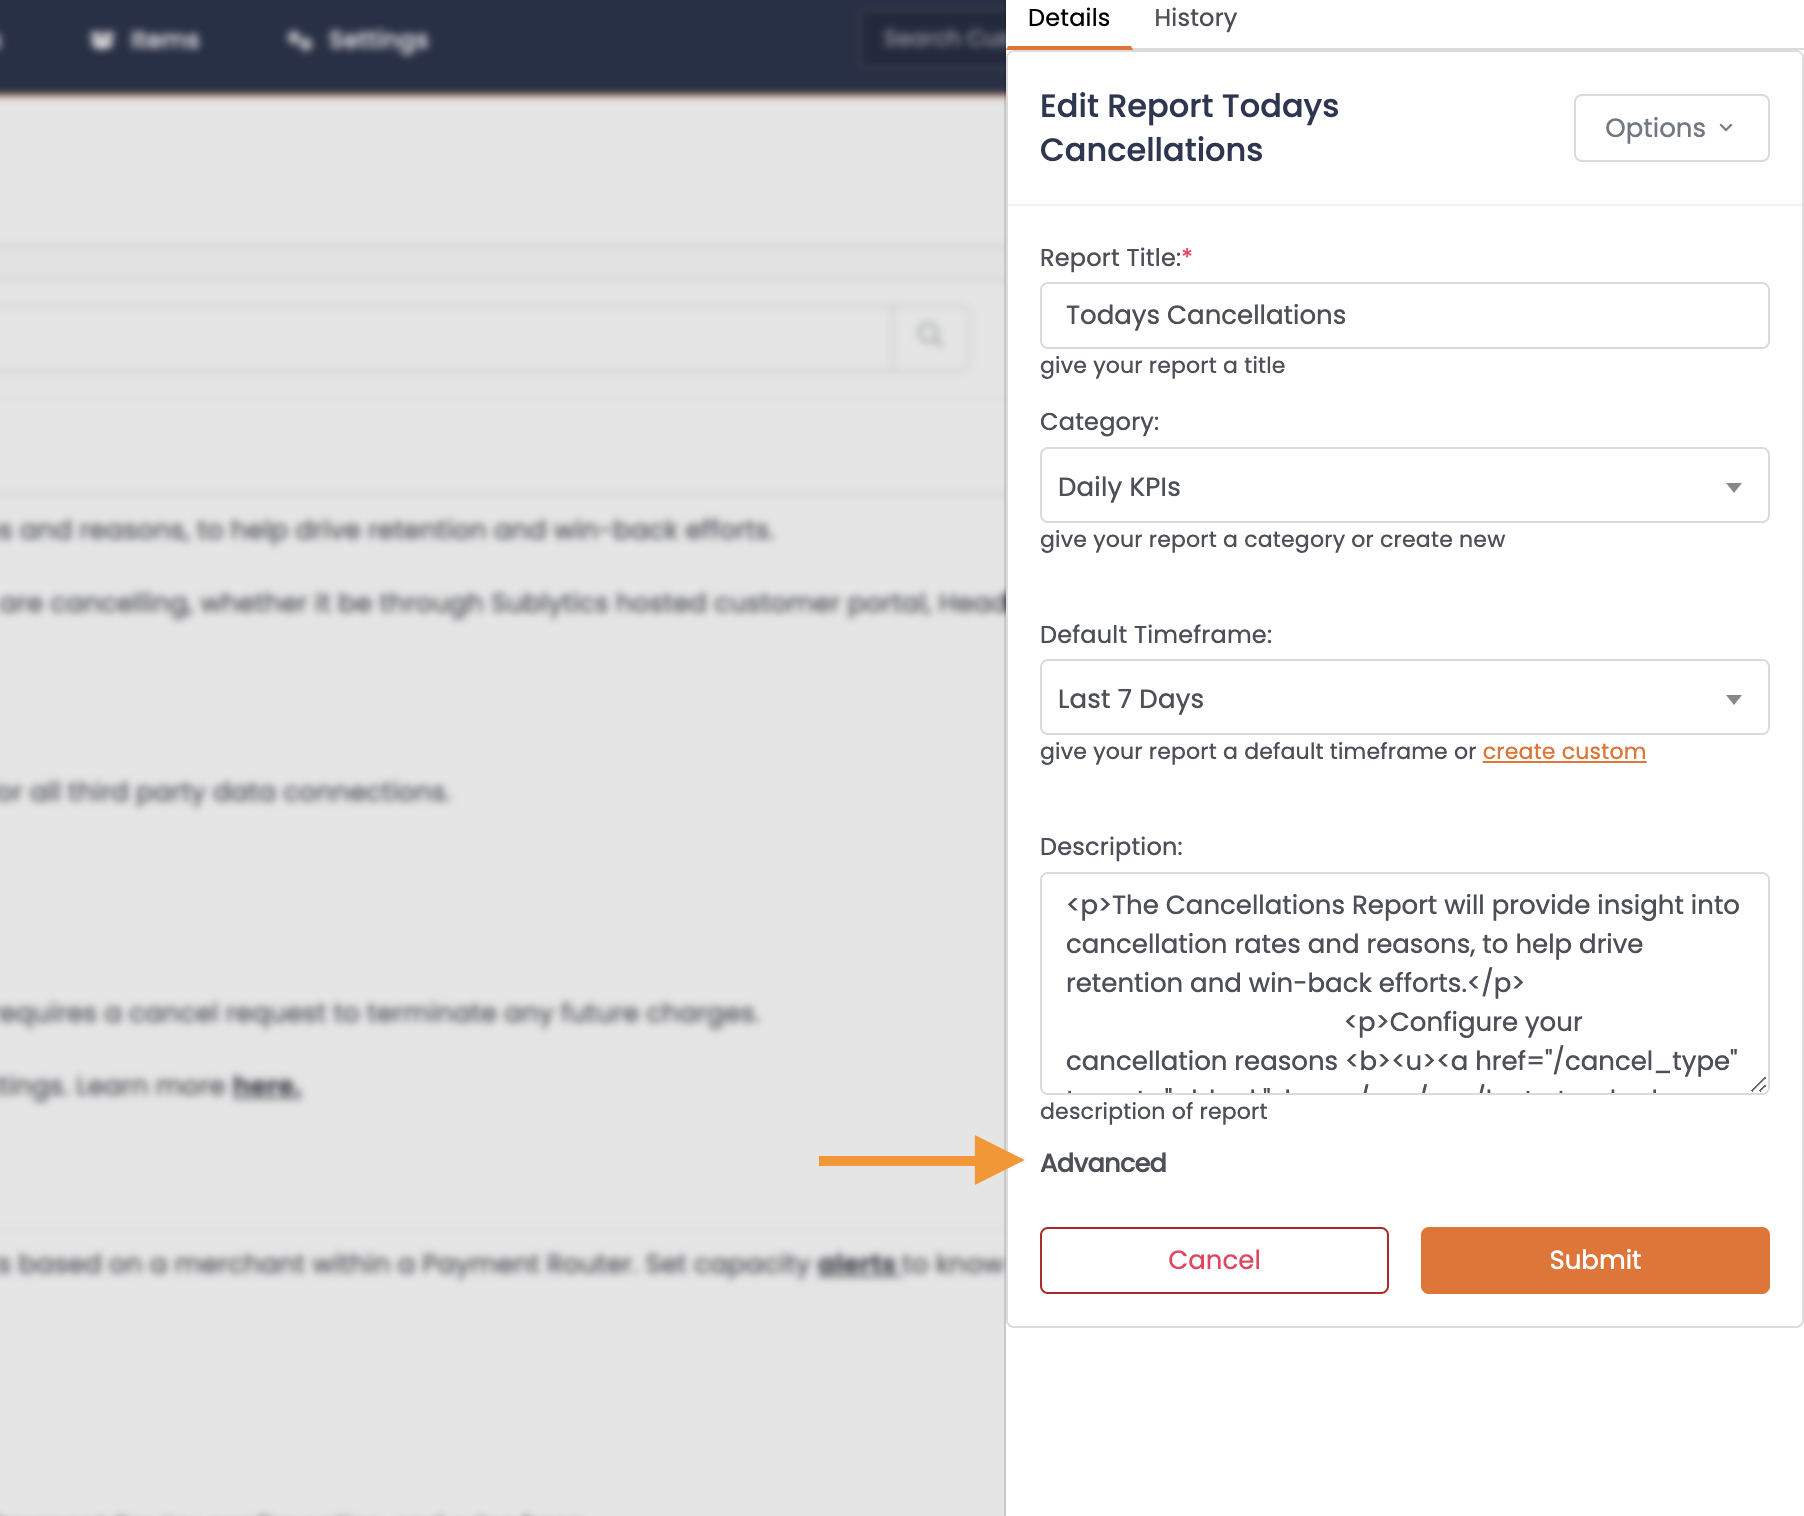
Click Advanced.
-
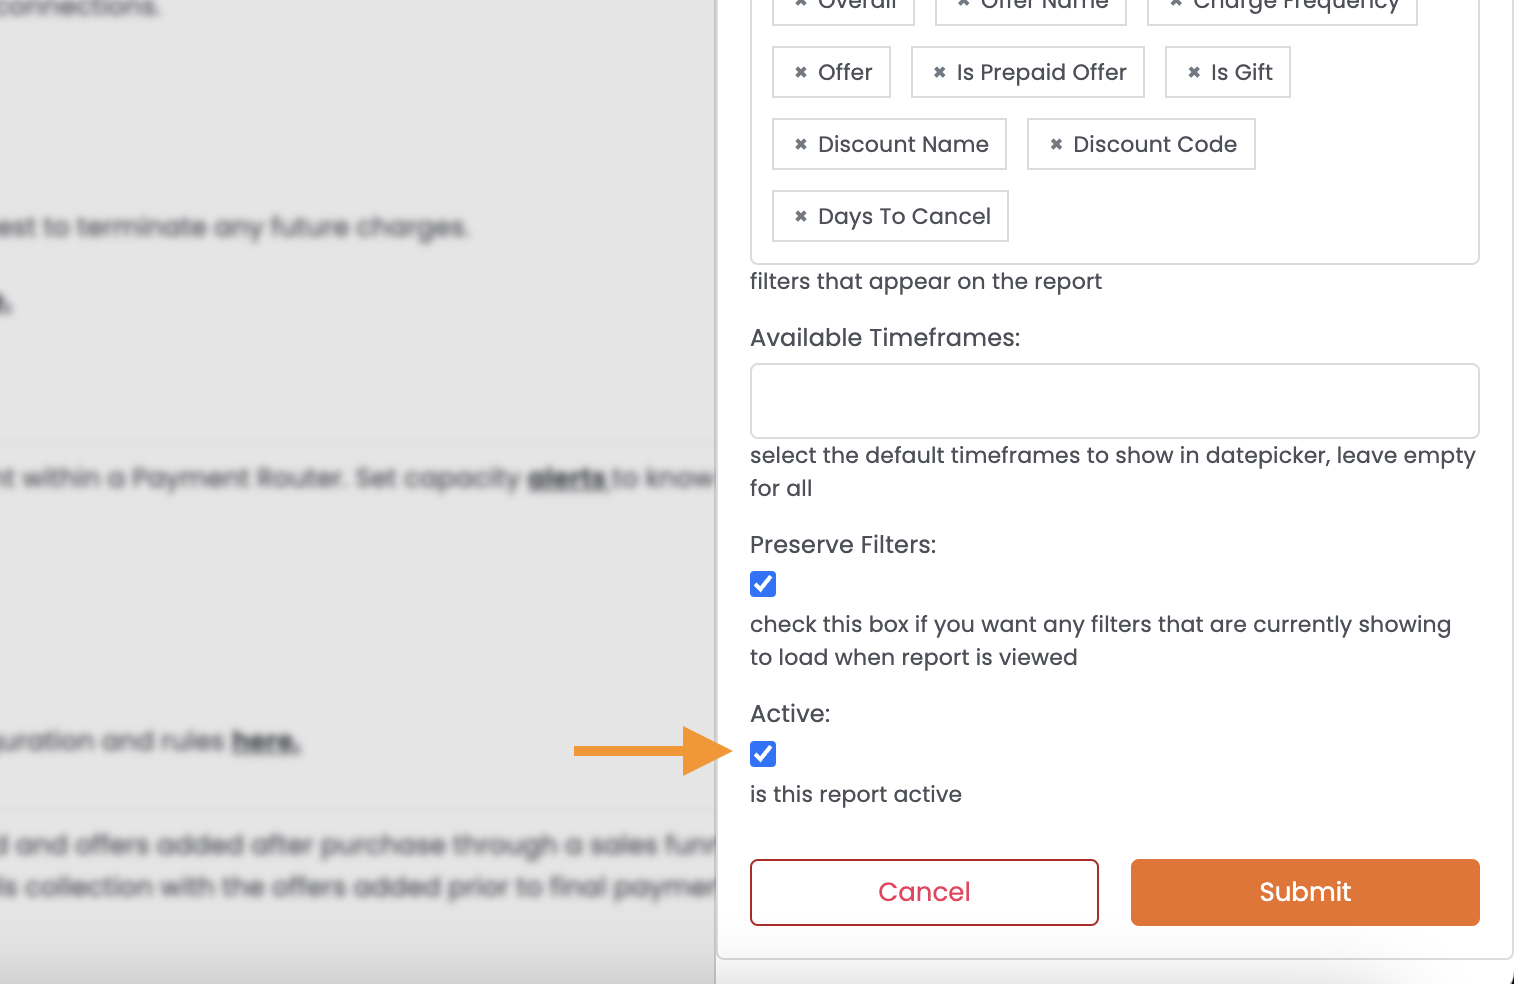
Uncheck Active.
-
Hit Submit.
Sharing a Saved Report
Saved reports are available to all admin users, and any user without reporting restrictions (access to all reports).
If a user has reporting restrictions to the reports they can view, and you save a new report, you will need to enable it to their User Group.