Report Builder Quick Guide
Master the pivot-style reporting platform with multi-dimensional data views. Learn about metrics, dimensions, date operators, and report customization features for flexible data analysis and insights.
Reports give you access to you all your data. You can examine your data in almost infinite combinations, display it in easy-to-understand formats, and share the resulting insights with others.
Key Takeaways
- Reports can be Saved to custom views and timeframes.
- Any Report or Metric can be saved and used as Counters or Widgets on your Dashboard
- Metrics can be delivered to your inbox via a Schedule or Alert
- Date Operators define how to interpret the date on each report. For example, you may want to search based on the customer acquired date or based on the date a sale is processed. Learn more about Date Operators.
- If you hover over any metric in a report you will see a metric definition and how it is calculated
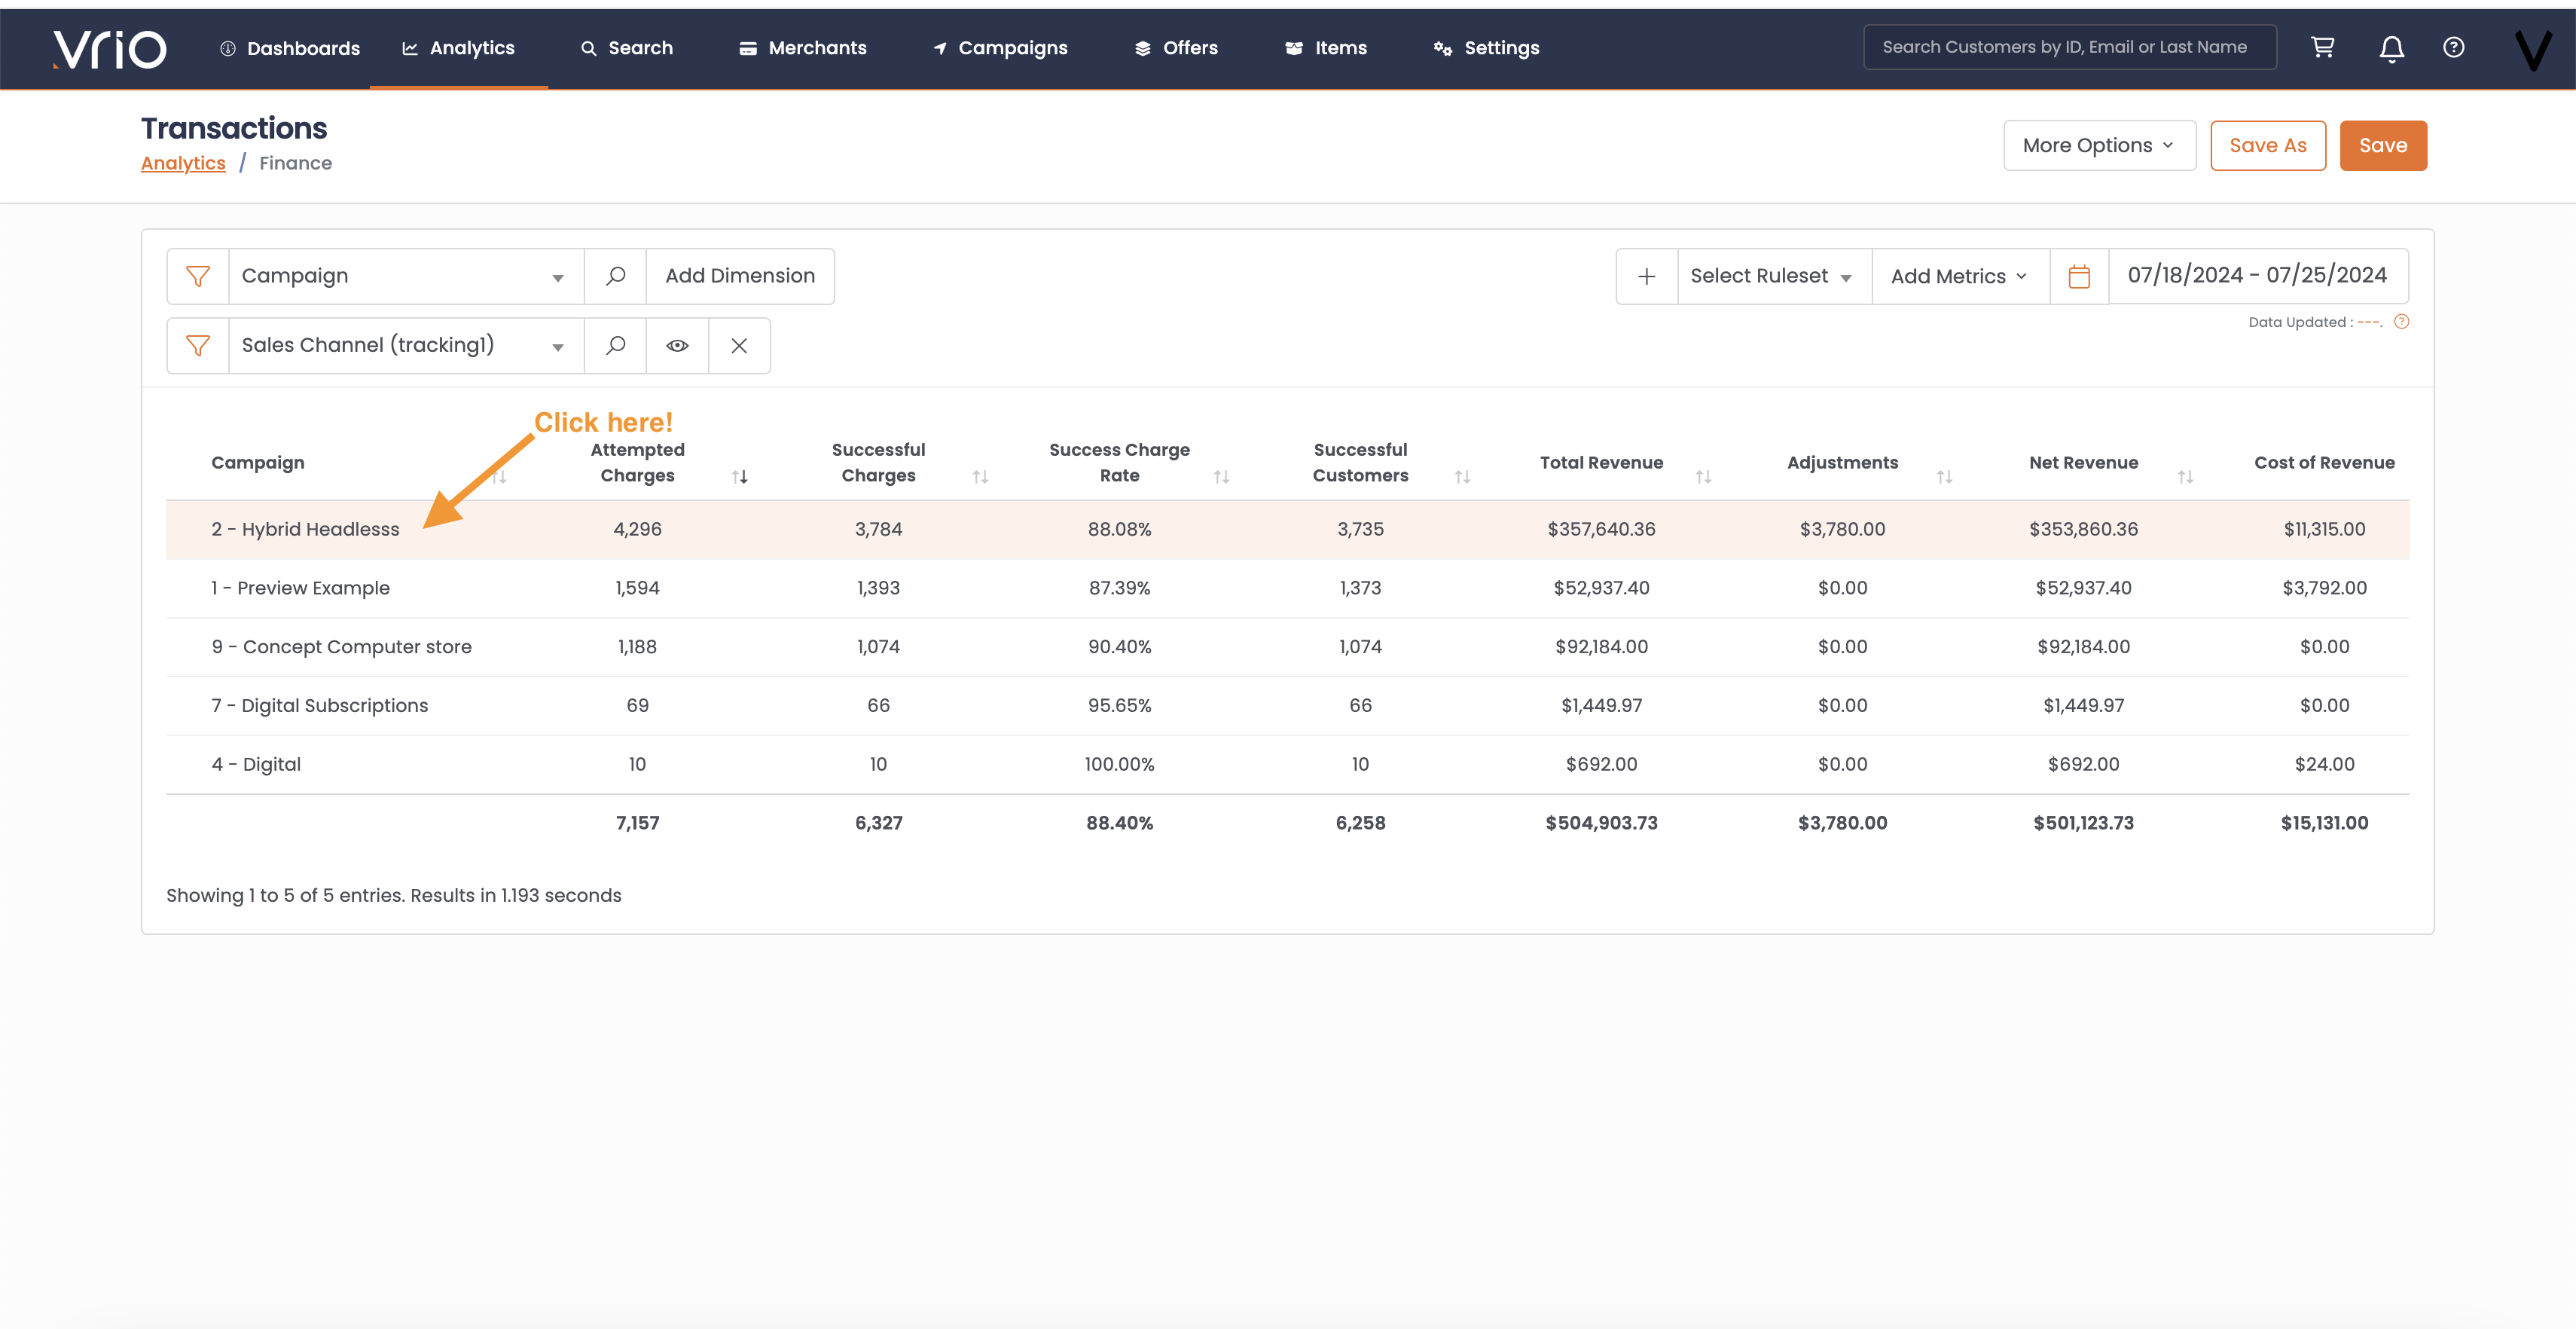
Common ErrorWhen adding multiple dimensions, expand by clicking on the row displayed to expand to the additional dimensions.
Be aware of one to many relationshipBecause of the access to many dimensions, there are scenarios where a one to many relationship can adjust the totals.
In a one-to-many relationship, one record in a table (order) can be associated with one or more records in another table(transactions). Conversely, each record in the second table is linked to only one record in the first.
A single customer can place multiple orders, that in turn can have multiple transactions, but each order is placed by only one customer.
Be aware of one to many relationships when dissecting the data.
Before building your first report, familiarize yourself with these features and concepts.
Report Builder
The report builder is a pivot style reporting platform. This allows for multi-dimensional data views and full flexibility on your data.
Within the Report Builder there are stock reports. Each stock report can be saved with a unique view - saving the dimensions and metrics in the view for each time you open that report.
The Report Builder also has many options for customization
- The layout will be the same across all reports, the data that is output, metrics and available filters will differ depending on the report.
- The Report Builder is where you choose the report type, metrics and filters that make up your report view.
- When creating or editing a report, choose which metrics you want to include in your report.
Metrics
Metrics are the columns output in each report.
- Every report has a summary view, displaying only a few selected metrics.
- Each report can be customized to enable or disable what metrics are displayed in that view.
- Hover over the header of any metric for a full definition and calculation of that metric.
- Enable all metrics by clicking on the Custom dropdown and selecting Show all
Dimensions
Dimensions are the rows that are output in each report.
- Every report relies on a starting (top) dimension, and allows the user to add additional layers.
- Once another dimension layer is added, click on the starting dimension to expand into additional layers.
Date Operator
Date Operators are what drives the underlying data in determining what is displayed.
There are many different date operators used across the reports.
It is key in knowing the date operator being used. Date operators
FAQ
Each report has a Help Tips section that will provide the following answers:
Q: What Questions Does This Report Answer?
Q: What is a Use Case Example?
Q: What are the Metrics on this Report?
Q: What is the Date Operator Used?
Q: What are the Filters I have access to?
See it in Action
Video Tutorial
A video demonstration of the Report Builder functionality is available.